> ## Documentation Index
> Fetch the complete documentation index at: https://docs.shieldlabs.ai/llms.txt
> Use this file to discover all available pages before exploring further.
# Traffic Analytics
> How ShieldLabs scores traffic quality by channel, referrer and campaign, and which sources bring risky users.
Traffic Analytics shows which acquisition channels, referrers and campaigns bring risky users, devices and visitors, and which bring real customers. ShieldLabs scores every identification, one check by the JavaScript snippet, and attributes it to its channel, referrer and UTM campaign. Traffic quality rolls those identifications up by source.
The same identifications also roll up to identities: users (your accounts, by the User HID you pass), devices (Device ID), visitors (Visitor ID, one device plus one cookie) and public IP addresses. The Device ID holds through cleared cookies, incognito mode and IP changes, so a person who clears cookies stays one device and becomes a new visitor. You can read a source by the users and devices it brings as well as by its identifications.
To act on one user or one identification, use the [Risk Score](/features/risk-scoring) and the [risk signals](/features/risk-signals) you receive by [webhook](/setup/webhooks) and read through the [History API](/api/server-api). You choose the action for each case.
## Channels, referrers and campaigns
ShieldLabs scores every acquisition channel, referrer and campaign by the Risk Score of the identifications it sends, not by volume alone. Two channels with the same number of identifications are not equal when one runs Trusted and the other runs Dangerous: that gap is the difference between paying for real customers and paying for masked traffic.
ShieldLabs assigns every identification to one acquisition channel: from the ad click ID first, then the UTM tags, then the referrer. The channel set is fixed:
| Channel | What it covers |
| - | - |
| **Google Ads** | Google ad clicks, by click ID or paid UTM tags |
| **Meta** | Facebook and Instagram, paid and organic |
| **TikTok** | TikTok, paid and organic |
| **LinkedIn** | LinkedIn, paid and organic |
| **X** | X, including `t.co` links, paid and organic |
| **Pinterest** | Pinterest, paid and organic |
| **Microsoft Ads** | Microsoft Advertising clicks, by click ID or paid UTM tags |
| **Organic Search** | Unpaid referrals from search engines |
| **Search bot** | Known search-engine crawlers (Googlebot, Bingbot and similar), identified by the `search_bot` flag. They get their own channel so crawler traffic stays out of the human channels, and their Risk Score is 0. |
| **Referral** | Links from other sites |
| **Direct** | No referrer and no campaign tags: a typed URL, a bookmark or a stripped referrer |
| **Other** | Campaign tags that match none of the channels above, for example `utm_source=newsletter` |
A source's risk is the average [Risk Score](/features/risk-scoring) of the identifications it sent, on the same 0 to 100 scale, read with its band:
| Band | Average Risk Score | What it means for the source |
| - | - | - |
| **Trusted** | 0-29 | No meaningful risk signals, or one minor risk signal on average. Real traffic. |
| **Suspicious** | 30-59 | Overlapping or moderate risk signals. A meaningful slice is masked. |
| **Dangerous** | 60-100 | Strong risk signals. Skews toward masked traffic. |
**Read a risky source together with its risk signals and the users it brings.** A source can run high for ordinary reasons: a privacy-conscious audience, a B2B segment behind corporate proxies, or a region where VPN use is common. The risk signals show why, and you choose the action for each case before you pause spend. See [Acting on results](/guides/acting-on-risk-score).
### Referrers and UTM campaigns
Inside a channel, break traffic quality down by the referring site and by UTM tags. Each identification carries them in `traffic_source` on the webhook: `channel`, `referrer_domain`, `landing_url`, `utm_source`, `utm_medium`, `utm_campaign`, `utm_content`, `utm_term` and `click_id_type`.
* **Referrer**: the referring site (for example `news.ycombinator.com`). This is how you find the one inbound link, partner site or affiliate sending masked traffic while the channel still looks fine.
* **UTM tags**: source, medium, campaign, term and content, as set on the landing URL.
| UTM field | Breaks the traffic down by |
| - | - |
| **Source** | `utm_source` (for example `newsletter`, `partner_x`) |
| **Medium** | `utm_medium` (for example `cpc`, `email`) |
| **Campaign** | `utm_campaign` (the specific campaign) |
| **Term** | `utm_term` (the paid keyword) |
| **Content** | `utm_content` (the specific creative or ad variant) |
This is the resolution that drives spend decisions. Google Ads averages 40, Suspicious. By UTM campaign, that is one clean campaign averaged with one at 80, Dangerous, and `utm_content` isolates the single creative behind it. You pause what the data shows, ranked by risk.
Dangerous identifications on ad and social channels are flagged too: `detection_flags.suspicious_paid_click` is `true` when an identification lands on the Google Ads, Meta, TikTok, LinkedIn, X, Pinterest or Microsoft Ads channel with a Risk Score of 60 or more. The flag carries no weight. The Meta, TikTok, LinkedIn, X and Pinterest channels include organic referrals, so read `click_id_type` and the UTM tags in `traffic_source` when you need paid clicks only. Use the flag to isolate Dangerous identifications on these channels without re-deriving channel and Risk Score yourself.
Rank each paid and organic source by the risk of the traffic it sends and the share of risky users it brings, and measure cost per real customer rather than cost per click. A campaign that sends 50,000 clicks at an average of 70, Dangerous, is inflating your click count and your real cost per customer.
## How it compares
Pageview analytics counts page loads and cookies. ShieldLabs answers the questions it leaves open:
| Question | What ShieldLabs gives you |
| - | - |
| **Who is behind the traffic?** | The user (by the User HID you pass), the device (Device ID) and the visitor (Visitor ID, one device plus one cookie) on each identification |
| **Is it the same device after cookies are cleared?** | Yes: the Device ID holds through cleared cookies, incognito mode and IP changes |
| **Which accounts, devices and IP addresses belong together?** | Each identification links its user, device, visitor, public IP and local IP ([how identities link](/concepts/entities)) |
| **Is the traffic real or masked?** | A [Risk Score](/features/risk-scoring) with every named risk signal on each identification |
| **Which source sends the risky traffic?** | The average Risk Score of each channel, referrer and campaign, with its band |
## Traffic quality
Traffic quality is the headline reading for a period: one figure on the same 0 to 100 scale as the Risk Score, computed from the period's identifications. On [Overview](/dashboard/overview), the **Traffic quality** gauge is the average Risk Score of the period's identifications, with its band word, next to the Identifications count and the Trusted, Suspicious and Dangerous shares.
Traffic quality counts identifications, the event layer. Users, devices and unique visitors count identities: one signed-in user who comes back on ten different days is at least ten identifications and one user. Read both: a source with many identifications from few users is a different problem from a source that brings many risky users.
Each identification also carries its country, browser, operating system, device type and [connection type](/features/risk-signals#connection-type), so the analytics dashboard breaks your traffic down by each of them. The analytics dashboard also plots risk over time and lists which [risk signals](/features/risk-signals) fired most in the period.
Behind every figure are the identifications themselves, one row each, keyed by `request_id`. On the Identifications tab of [Analytics](/dashboard/analytics) you can:
* **Filter** by band (Trusted, Suspicious, Dangerous) and by High-Risk Events, country, browser, OS, device type, connection type, domain, channel, source, campaign, entry page and risk signals.
* **Search** by one identifier: `user_hid`, `device_id`, `visitor_id`, `ip`, `request_id`, `session_id` or `cookie_id`.
* **Sort** by date and Risk Score.
* **Export** the identifications behind the current view to CSV. Exports never count against your included identifications. The export holds every identification in the current filter, not only the visible page, up to 10,000 rows.
## Reading a risky source
When a channel, referrer or campaign runs Suspicious or Dangerous:
1. **Read the risk signals** that push its average up: VPN and proxy traffic, datacenter IPs, anti-detect browsers, browser automation. What each one means is on [Risk Signals](/features/risk-signals).
2. **Look at who the traffic belongs to.** Export the source's identifications, or read them in your backend, and count distinct users and devices. Many identifications from a handful of devices is automated or farmed traffic. Several new accounts on the same devices is what ShieldLabs detects as [Multi-accounting](/features/high-risk-events#multi-accounting); High-Risk Events are available in the analytics dashboard, the API and webhooks.
3. **Act per source and per account.** Pause the placement, hold the affiliate's payout, and step up or review the accounts the source brought. You choose the action for each case.
## Traffic quality in your backend
Each webhook carries the identification's source in `traffic_source`, next to its `user_hid`, `device_id` and `risk_score`. Aggregate on the identities to score campaigns by the users they bring, not by clicks:
```js Risky users per campaign (Node.js) theme={null}
// Call with body.data of each verified identification.scored webhook.
function trackSource(data) {
if (data.risk_score > 100) return; // 999 is the rate-limit marker, not a Risk Score
const source = data.traffic_source ?? {};
const campaign = source.utm_campaign || source.channel || 'unattributed';
const band = data.risk_score >= 60 ? 'Dangerous' : data.risk_score >= 30 ? 'Suspicious' : 'Trusted';
metrics.record(campaign, {
user: data.user_hid === 'anonymous' ? null : data.user_hid,
device: data.device_id,
band,
});
}
// Report per campaign: distinct users and devices by their worst band, next to spend.
```
## In the analytics dashboard

 * **[Overview](/dashboard/overview)** opens with **Traffic quality**. The **Top channels** list shows the identifications and the average Risk Score of each channel. The other top lists cover countries, browsers, OS, connection types and device types. The **Unique visitors** panel counts good bots (search-engine crawlers) and bad bots (browser automation) among your visitors.
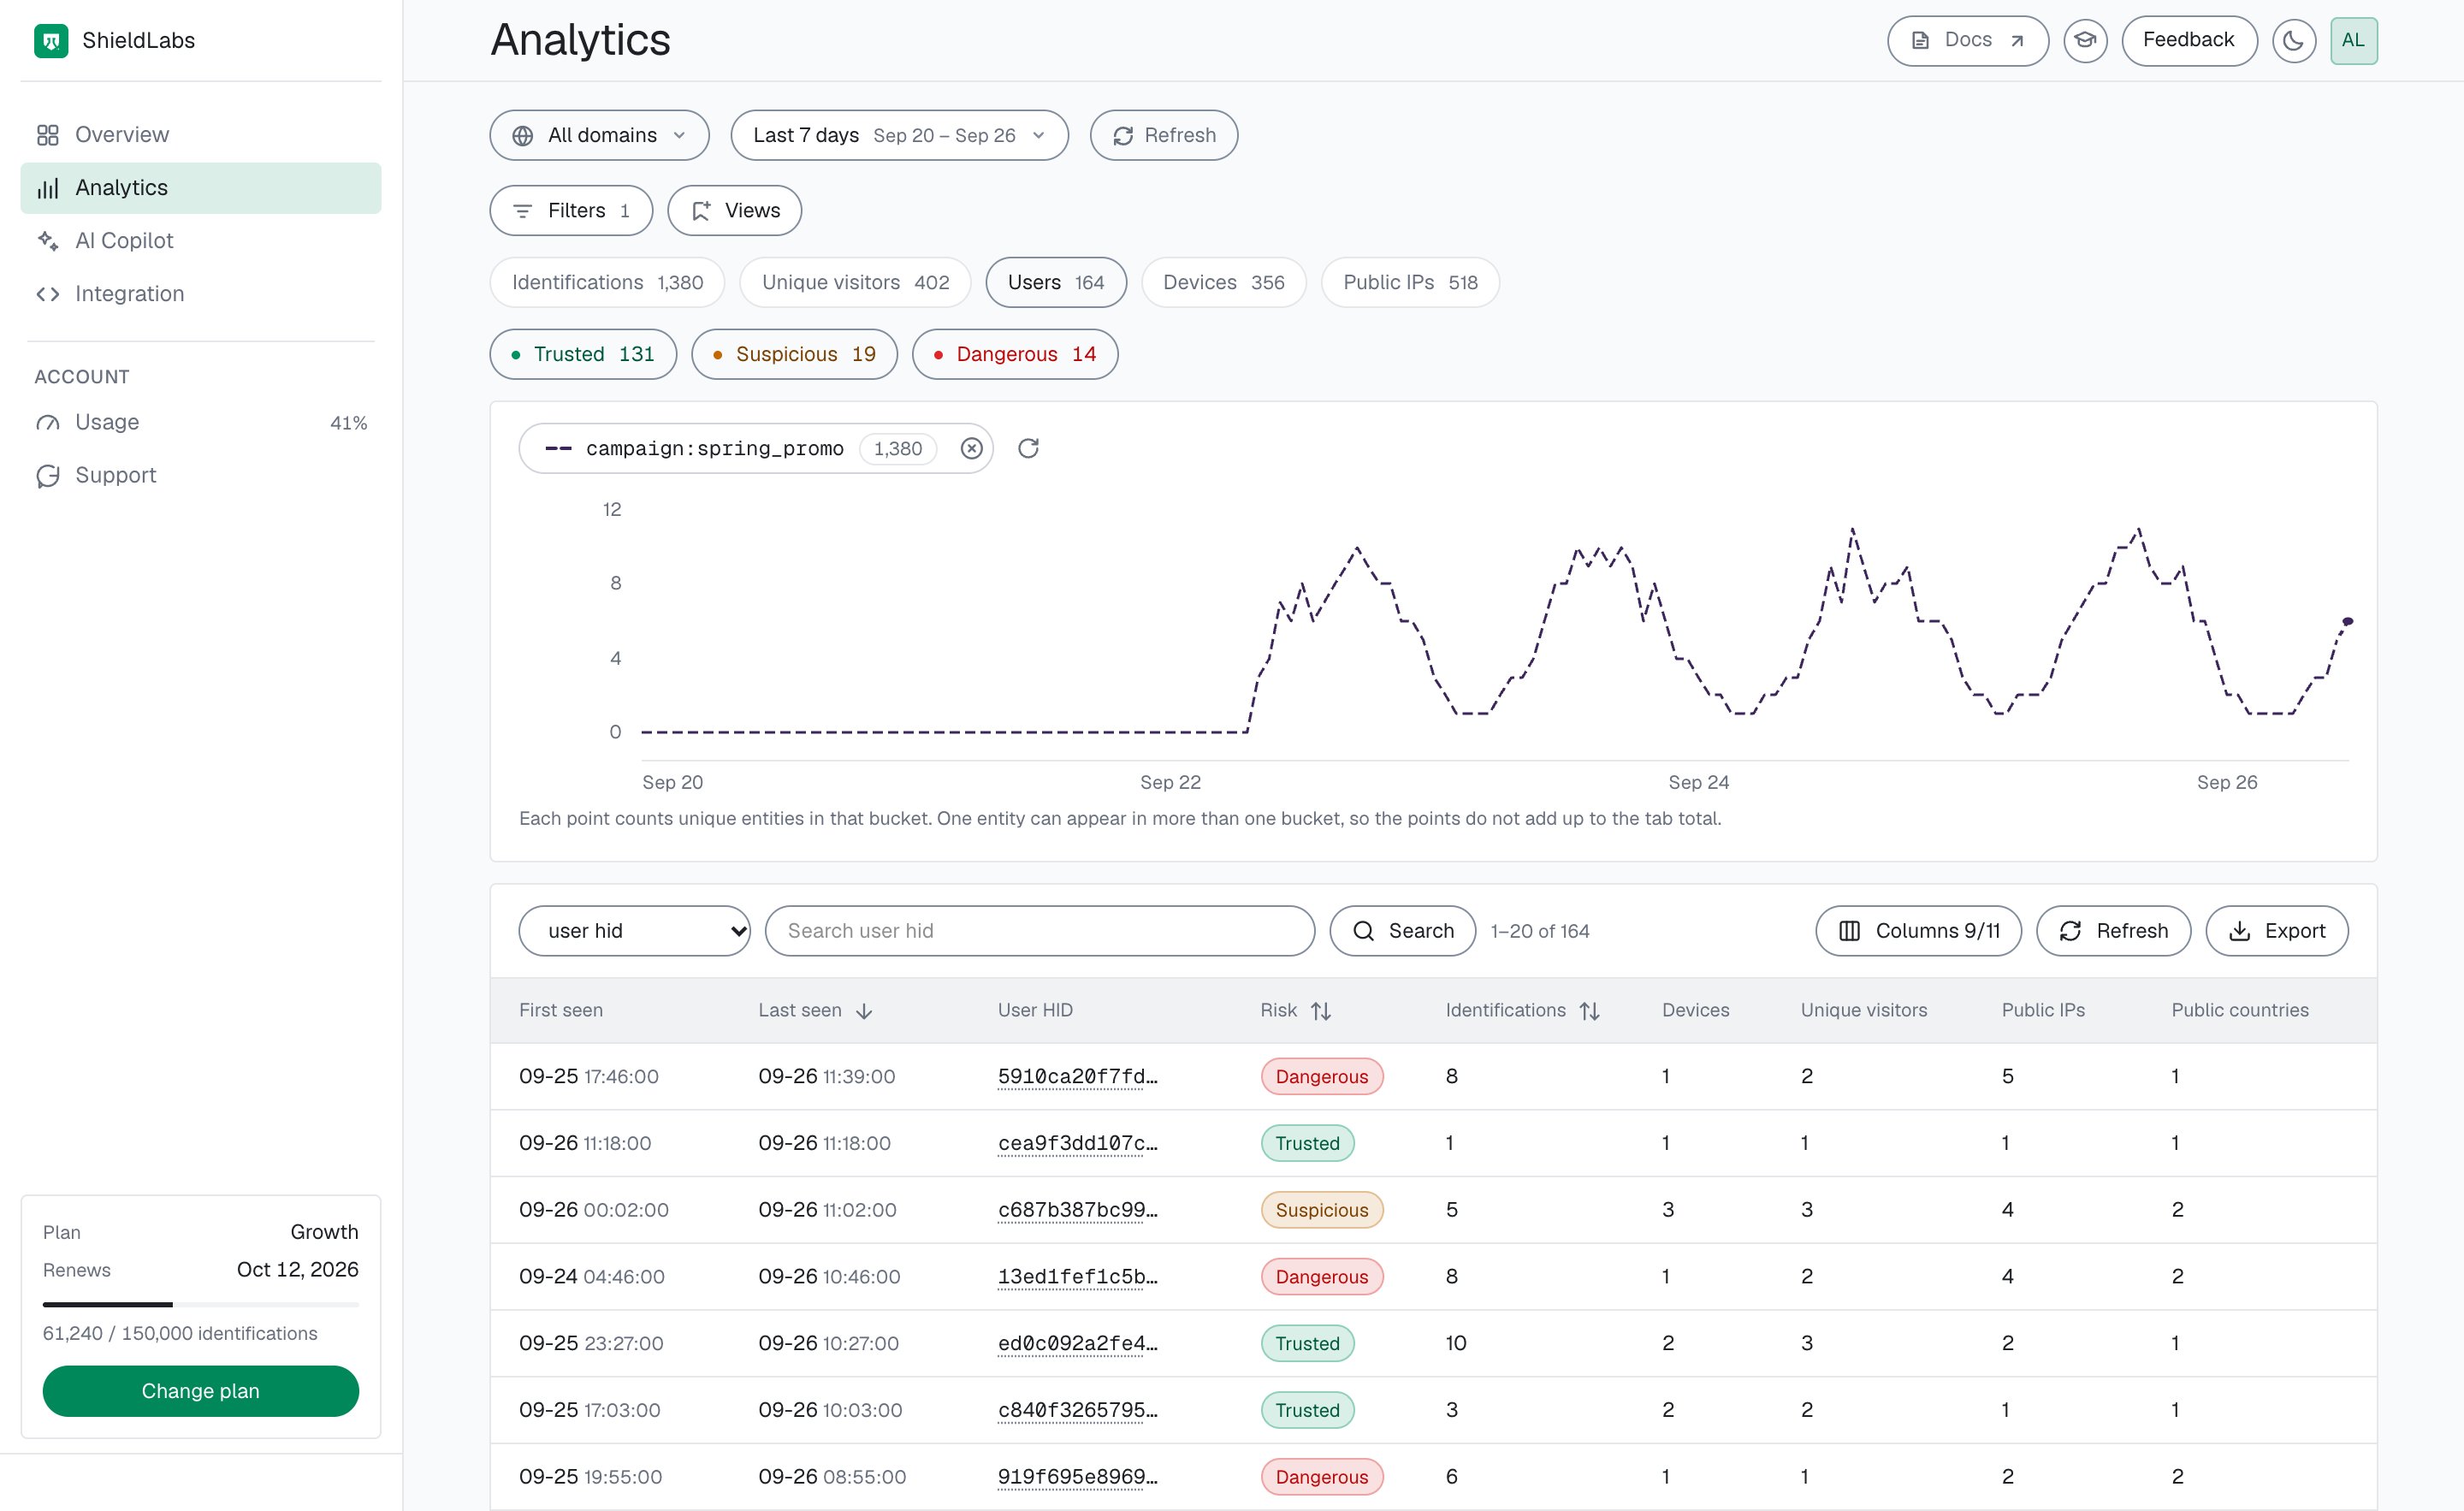
* **Click a channel** to open [Analytics](/dashboard/analytics) filtered to it. Switch to the **Users** tab to see the users whose own identifications carry that channel, each with its worst band; open a user to see its High-Risk Events. The **Unique visitors**, **Devices** and **Public IPs** tabs work the same way. Add **Source**, **Campaign** or **Entry page** filters to narrow it to one campaign.
* **Open a user** to see its linked devices, visitors and IP addresses, and the identifications behind its band ([User, device, visitor and IP cards](/dashboard/entity-card)).
* **[Overview](/dashboard/overview)** opens with **Traffic quality**. The **Top channels** list shows the identifications and the average Risk Score of each channel. The other top lists cover countries, browsers, OS, connection types and device types. The **Unique visitors** panel counts good bots (search-engine crawlers) and bad bots (browser automation) among your visitors.
* **Click a channel** to open [Analytics](/dashboard/analytics) filtered to it. Switch to the **Users** tab to see the users whose own identifications carry that channel, each with its worst band; open a user to see its High-Risk Events. The **Unique visitors**, **Devices** and **Public IPs** tabs work the same way. Add **Source**, **Campaign** or **Entry page** filters to narrow it to one campaign.
* **Open a user** to see its linked devices, visitors and IP addresses, and the identifications behind its band ([User, device, visitor and IP cards](/dashboard/entity-card)).
 ## Next steps
Every risk signal behind a source's risk, from VPN and Tor to anti-detect browsers and browser automation, with its weight.
Measure traffic quality per source over time and track cost per real customer in your backend.
Score traffic per affiliate and per campaign, find the partner sending masked clicks, and reconcile payouts against the real customers each partner brings.
This documentation is built and hosted on [Mintlify](https://mintlify.com), a developer documentation platform.
## Next steps
Every risk signal behind a source's risk, from VPN and Tor to anti-detect browsers and browser automation, with its weight.
Measure traffic quality per source over time and track cost per real customer in your backend.
Score traffic per affiliate and per campaign, find the partner sending masked clicks, and reconcile payouts against the real customers each partner brings.
This documentation is built and hosted on [Mintlify](https://mintlify.com), a developer documentation platform.