> ## Documentation Index
> Fetch the complete documentation index at: https://docs.shieldlabs.ai/llms.txt
> Use this file to discover all available pages before exploring further.
# Rate limits
> The limits ShieldLabs applies to identification and API traffic, and how to stay within them.
These limits protect the ingest infrastructure and sit outside the Risk Score: the [Risk Score](/features/risk-scoring) of each identification is `0-100` (Trusted / Suspicious / Dangerous) and comes only from its risk signals. The one exception is the `999` ban marker described below. This page is about keeping the gateway healthy under load.
In normal use you rarely hit these limits. Within one visit, the [snippet](/setup/snippet) runs at most one identification every five minutes for the same user for `checkAnonymous` and `checkAuthenticatedUser`, shared across open tabs; only `forceCheck*` calls run every time. Limits exist to absorb abusive traffic, not legitimate integration patterns.
## The limits at a glance
The snippet posts collected signals to `rest.shieldlabs.ai`. That ingest gateway applies protections in this order: **per IP**, then **domain freeze / per domain** (by [plan](/billing)). `/health` is not rate-limited.
| Protection | Scope | Limit | Response when exceeded |
| - | - | - | - |
| Per-IP rate limit | Source IP | 15 requests / minute | `429 Too Many Requests`, then a **10-minute** IP ban |
| Per-domain ingest | One registered domain, all visitor IPs together | Free/Starter **5**/s, Growth **10**/s, Scale **15**/s | `429` only; the domain is **not** banned |
| Domain freeze | Registered domain | 10 seconds in a row at that plan cap | Processing pauses (same `429`). Those requests are not billed. Clears after 10 quieter seconds. Not the **Paused** status and not the IP ban. |
| Concurrency cap | Whole gateway, in-flight | 512 simultaneous connections | `503 Service Unavailable` |
| Request body size | Per request | 512 KB | Request rejected |
None of these feed the Risk Score. A sticky IP ban can still surface the marker value `999` in a stored identification (see below). Soft `429`s on the domain cap or a **domain freeze** do **not** write `999`.
The **Management API** on `api.shieldlabs.ai` applies the same **per-IP** limit (15/min, 10-minute ban) and concurrency cap (512 in-flight) independently. It does not use the per-domain limits. A `429` or `503` there returns `{"error":"too many requests"}` or `{"error":"server is busy"}`.
The [History API](/api/server-api) on `account.shieldlabs.ai` (`/api/v1` and legacy `/pub`) is **not** the ingest gateway. It has its own soft cap: **15 requests per second per domain** (each Private API Key reads one domain). Crossing it returns `429` `{"error":"too many requests"}` with **no sticky ban**: retry in the next second. One History lookup after each identification stays inside this ceiling even at the Scale ingest rate (15 per second).
## Per-IP rate limit and the 10-minute ban
A single source IP may make up to **15 requests per minute** to the REST ingest endpoint. One identification uses three to five of those requests (a challenge, the identification itself and its follow-up network checks), so one IP can run only about three to five identifications per minute before the ban. Cross the limit and the gateway returns:
```http theme={null}
HTTP/1.1 429 Too Many Requests
Content-Type: application/json
{ "error": "too many requests" }
```
After the limit is crossed, that IP is **banned for 10 minutes**. During the ban window, further requests from the same IP continue to be rejected with `429`. The ban clears automatically; there is no manual unban step and nothing to configure.
Because the limit is **per source IP**, be careful in environments where many real users share one egress IP (a corporate NAT, a mobile carrier gateway, a shipping/CI proxy). In those setups a normal crowd of users can look like one busy IP. If you proxy snippet traffic through your own backend, you collapse every user onto your server's IP and will hit this limit fast. Let the snippet post directly from the browser instead.
### Guard against the "999" ban marker
When an IP is **banned**, the **browser receives the `429`**, but your backend can still see an identification for that request: ShieldLabs writes a marker value of `999` to mark the banned request, and that identification can reach you on a [webhook](/setup/webhooks) delivery or a [History API](/api/server-api) row. The `999` is not capped to 100 on the ban path, so it arrives as-is. You may therefore receive a payload where `data.risk_score` (webhook) or `score` (History API) is `999`.
A `429` from the **per-domain** cap or a **domain freeze** is a soft reject: no ban, and no `999` marker.
**Guard for `999` before you read the band.** A rate-limit ban happens at the gateway, outside the Risk Score, but its `999` marker can land in a webhook or History row uncapped. Keep those rows out of your score logic at the top of your handler:
```js theme={null}
// Webhook handler. The Risk Score is 0-100; a value above 100 is the rate-limit ban marker.
const score = req.body?.data?.risk_score;
if (score > 100) return res.sendStatus(200); // acknowledge, then ignore
// History API rows: drop the marker before you read the band.
const rows = history.data.filter((row) => row.score <= 100);
```
Branch your decision logic only on a Risk Score in the `0-100` range. Read a `999` as "this IP was rate-limited at the gateway": send the action it belongs to for review rather than allowing it, and look at the `429` status, not the number.
## Per-domain ingest (soft 429)
Every request for one registered host shares a single per-second budget, regardless of how many visitor IPs are hitting it. The budget follows the account [plan](/billing):
| Plan | Requests / second per domain |
| - | - |
| Free | 5 |
| Starter | 5 |
| Growth | 10 |
| Scale | 15 |
Exceeding the budget returns the same `429` body as the per-IP limit. The domain is **not** banned; traffic is accepted again in the next second. Upgrade the plan if a busy site needs more headroom. How many domains you may hold is separate; see [Domains](/setup/domains).
## Domain freeze (plan RPS)
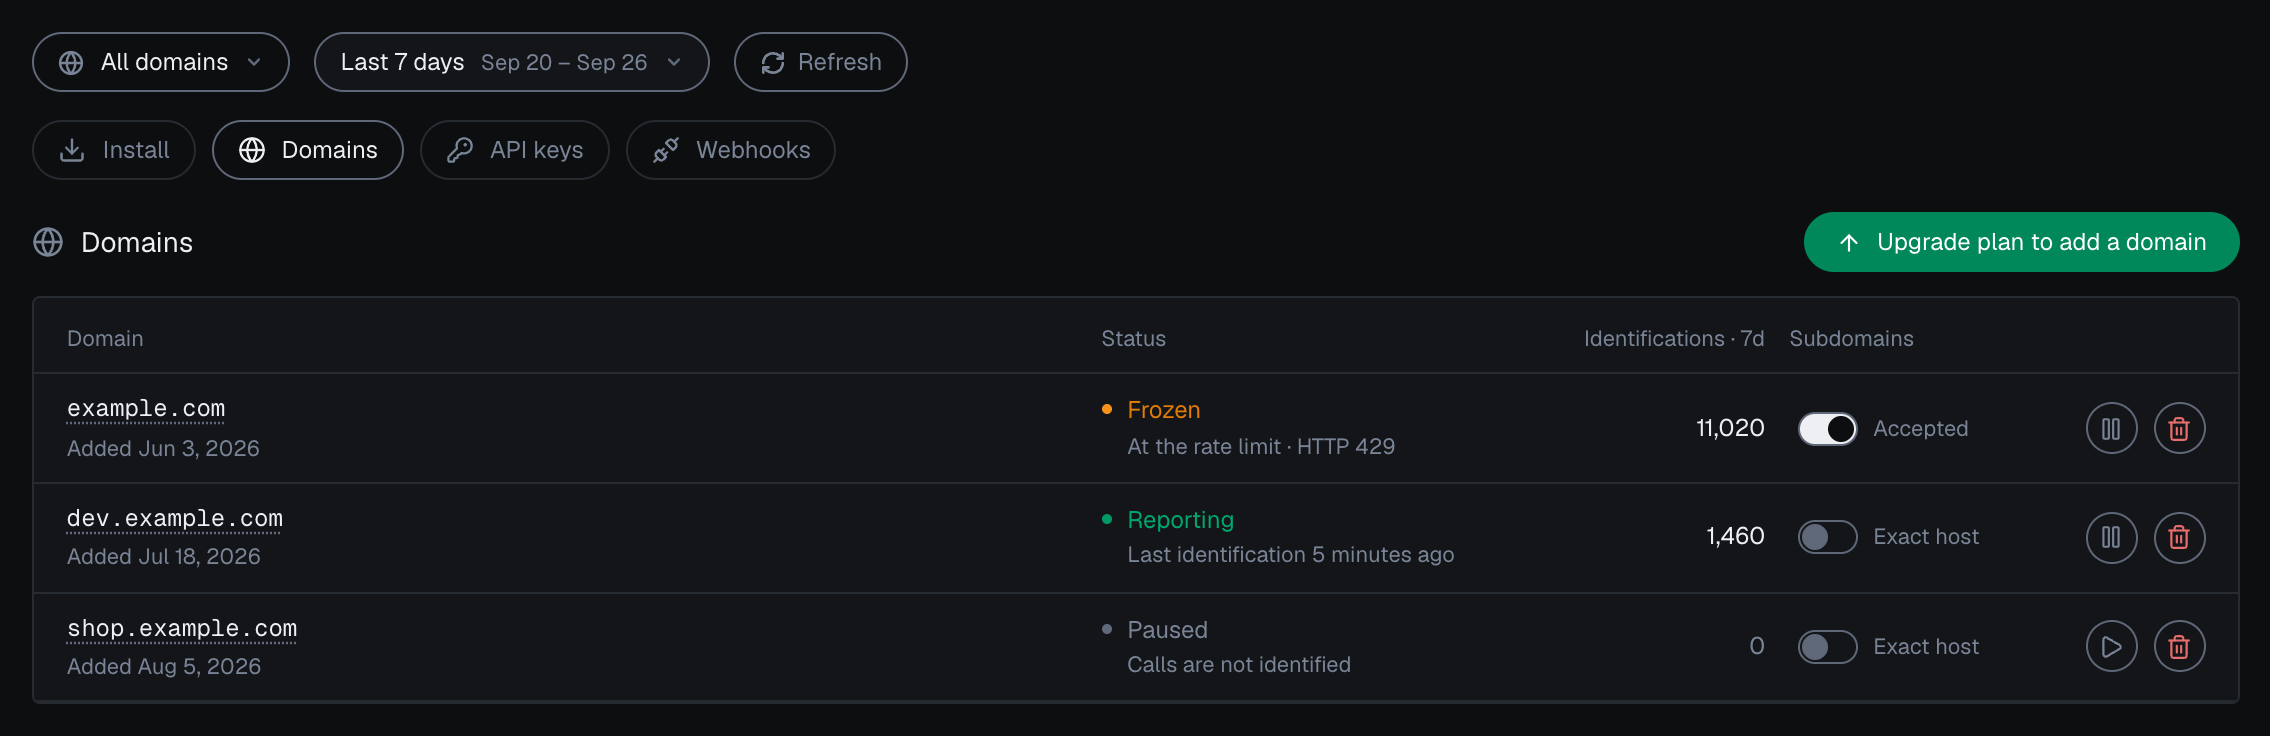
If the domain stays **at that cap for 10 seconds in a row**, ShieldLabs **pauses processing** for that domain: further requests get the same `429` JSON, they are **not scored**, and they **are not billed**. The network check for that domain is paused the same way. This is not the **Paused** status and not the per-IP 10-minute ban (no `999`). Processing starts again after 10 consecutive seconds below the cap.
In the analytics dashboard, open **Integration > Domains**: the domain shows the **Frozen** status with **At the rate limit · HTTP 429**. On **Integration > Install**, a banner for the frozen domain explains that its calls are not billed and that it resumes on its own once traffic eases. The account owner also gets at most one email per domain every 24 hours. [Integration](/dashboard/integration) describes every domain status.


 ## Concurrency cap (503)
Independent of the rate limits, the gateway caps the number of **simultaneous in-flight requests** across all traffic. When that cap (512 connections) is saturated, new requests get:
```http theme={null}
HTTP/1.1 503 Service Unavailable
Content-Type: application/json
{ "error": "server is busy" }
```
A `503` here means "try again shortly," not "you did something wrong." It is transient back-pressure. The snippet does not need special handling for this; if you call the [Management API](/api/server-api) server-side and hit a `503`, retry with a short backoff.
## Request body size (512 KB)
Each request body to the REST gateway is capped at **512 KB**. The signal payload the snippet sends is well under this in normal operation, so you will not approach the cap unless something is wrong upstream (for example, a payload being duplicated or wrapped before it reaches the gateway). Oversized bodies are rejected before scoring.
## Included volume is separate (402)
Reaching your included volume is a billing condition, separate from rate limits, with its own status code:
```http theme={null}
HTTP/1.1 402 Payment Required
```
A `402` means your account's included volume is used up, so the identification request cannot be processed. It is unrelated to how fast you send traffic. Identification resumes when the billing cycle resets or when you change plan. The [Billing](/billing) page covers how identifications are counted, and the [Errors](/errors) page lists the full status-code reference.
## How to stay within the limits
The [snippet](/setup/snippet) is designed to call `rest.shieldlabs.ai` directly from each visitor's browser, so requests are naturally spread across many client IPs. Do not relay snippet traffic through a single server, which would funnel everyone onto one IP and trip the 15/minute limit.
`checkAnonymous` and `checkAuthenticatedUser` run at most one identification every five minutes for the same user within one visit, shared across open tabs. On a multi-page site, a full page load in the only open tab can start a new visit. Use `forceCheckAnonymous` / `forceCheckAuthenticatedUser` only at meaningful moments (right after login, before a sensitive action), not in a loop.
Get results from the [webhook](/setup/webhooks) (delivered automatically) or, when you need a guaranteed read, from the [History API](/api/server-api). Do not re-fire identification calls to "refresh" a Risk Score.
For a **per-IP** `429`, treat that IP as blocked until the 10-minute ban window passes. For a **domain** `429`, wait a second and retry. Treat `503` as transient and retry after a short, jittered delay.
## Quick reference
| Status | Cause | What it means for you |
| - | - | - |
| `429` | More than 15 requests/minute from one IP | That IP is banned for 10 minutes. Spread traffic across client IPs; do not proxy through one server. A banned request can surface a Risk Score of `999`. |
| `429` | Domain over its plan ingest RPS (5 / 5 / 10 / 15) | Soft reject for that second. The domain is not banned. Upgrade if the site needs more headroom. |
| `429` | Domain freeze (10s at plan cap) | Processing paused; not billed; not `999`; not the **Paused** status. |
| `429` | History API over 15 req/s per domain | Soft reject for that second. No ban. Retry shortly. |
| `503` | Gateway concurrency cap reached | Transient back-pressure. Retry with a short backoff. |
| `402` | Account's included volume used up | A [billing](/billing) condition, not a rate limit. Resumes when the billing cycle resets or you change plan. |
| Rejected body | Request body over 512 KB | Payload too large for the ingest endpoint. |
The [Errors](/errors) page documents every status code ShieldLabs can return and how to handle it.
This documentation is built and hosted on [Mintlify](https://mintlify.com), a developer documentation platform.
## Concurrency cap (503)
Independent of the rate limits, the gateway caps the number of **simultaneous in-flight requests** across all traffic. When that cap (512 connections) is saturated, new requests get:
```http theme={null}
HTTP/1.1 503 Service Unavailable
Content-Type: application/json
{ "error": "server is busy" }
```
A `503` here means "try again shortly," not "you did something wrong." It is transient back-pressure. The snippet does not need special handling for this; if you call the [Management API](/api/server-api) server-side and hit a `503`, retry with a short backoff.
## Request body size (512 KB)
Each request body to the REST gateway is capped at **512 KB**. The signal payload the snippet sends is well under this in normal operation, so you will not approach the cap unless something is wrong upstream (for example, a payload being duplicated or wrapped before it reaches the gateway). Oversized bodies are rejected before scoring.
## Included volume is separate (402)
Reaching your included volume is a billing condition, separate from rate limits, with its own status code:
```http theme={null}
HTTP/1.1 402 Payment Required
```
A `402` means your account's included volume is used up, so the identification request cannot be processed. It is unrelated to how fast you send traffic. Identification resumes when the billing cycle resets or when you change plan. The [Billing](/billing) page covers how identifications are counted, and the [Errors](/errors) page lists the full status-code reference.
## How to stay within the limits
The [snippet](/setup/snippet) is designed to call `rest.shieldlabs.ai` directly from each visitor's browser, so requests are naturally spread across many client IPs. Do not relay snippet traffic through a single server, which would funnel everyone onto one IP and trip the 15/minute limit.
`checkAnonymous` and `checkAuthenticatedUser` run at most one identification every five minutes for the same user within one visit, shared across open tabs. On a multi-page site, a full page load in the only open tab can start a new visit. Use `forceCheckAnonymous` / `forceCheckAuthenticatedUser` only at meaningful moments (right after login, before a sensitive action), not in a loop.
Get results from the [webhook](/setup/webhooks) (delivered automatically) or, when you need a guaranteed read, from the [History API](/api/server-api). Do not re-fire identification calls to "refresh" a Risk Score.
For a **per-IP** `429`, treat that IP as blocked until the 10-minute ban window passes. For a **domain** `429`, wait a second and retry. Treat `503` as transient and retry after a short, jittered delay.
## Quick reference
| Status | Cause | What it means for you |
| - | - | - |
| `429` | More than 15 requests/minute from one IP | That IP is banned for 10 minutes. Spread traffic across client IPs; do not proxy through one server. A banned request can surface a Risk Score of `999`. |
| `429` | Domain over its plan ingest RPS (5 / 5 / 10 / 15) | Soft reject for that second. The domain is not banned. Upgrade if the site needs more headroom. |
| `429` | Domain freeze (10s at plan cap) | Processing paused; not billed; not `999`; not the **Paused** status. |
| `429` | History API over 15 req/s per domain | Soft reject for that second. No ban. Retry shortly. |
| `503` | Gateway concurrency cap reached | Transient back-pressure. Retry with a short backoff. |
| `402` | Account's included volume used up | A [billing](/billing) condition, not a rate limit. Resumes when the billing cycle resets or you change plan. |
| Rejected body | Request body over 512 KB | Payload too large for the ingest endpoint. |
The [Errors](/errors) page documents every status code ShieldLabs can return and how to handle it.
This documentation is built and hosted on [Mintlify](https://mintlify.com), a developer documentation platform.