> ## Documentation Index
> Fetch the complete documentation index at: https://docs.shieldlabs.ai/llms.txt
> Use this file to discover all available pages before exploring further.
# Troubleshooting
> Fixes for the issues you are most likely to hit while integrating ShieldLabs.
A fast path from a symptom to its fix. Each entry names the likely cause and the one change that resolves it, then points you to the page with the full detail. For the meaning of a specific status code, the [Errors](/errors) reference is the canonical table; for short answers to common questions, start with the [FAQ](/faq).
## Install and data flow
**Symptom.** Nothing reaches your analytics dashboard or webhook, and the browser never posts an identification.
**Cause.** One of three things is blocking the snippet before it can run:
* A **Content Security Policy** is refusing the hosts the snippet needs. The module and its dependency load under `script-src`, and the identification and network checks post under `connect-src`. A policy missing those hosts stops the snippet cold.
* An **ad blocker or content blocker** is dropping the CDN host, so the module never downloads.
* The page is **not served over HTTPS**. The snippet collects signals in a secure context only, so it does not run on plain `http://` or a non-secure origin.
**Fix.** Open the browser dev tools. A CSP block shows a `Refused to load` or `Refused to connect` error naming the directive and host, which is your signal to add that host. The exact directives and host list live on the [CSP setup](/setup/csp) page, and the [snippet install guide](/setup/snippet) shows the HTML and framework methods. Confirm the page loads over HTTPS, then load it with any blockers disabled to rule the extension in or out. Make sure the page also calls `checkAnonymous()` or `checkAuthenticatedUser(hashedId)` once the module loads. Once identifications arrive, **Integration > Domains** in the analytics dashboard shows the domain as **Reporting**.
**Symptom.** The identification runs and counts, its Risk Score shows in the analytics dashboard, but your endpoint never receives the POST.
**Cause.** Either no webhook endpoint is active for the domain, or the delivery was dropped. Webhook delivery is at-most-once, with no retries and a 1-second timeout, so a slow, down, or non-2xx endpoint silently loses that delivery, and there is no resend.
**Fix.** In the [analytics dashboard](https://app.shieldlabs.ai/), open **Integration > Webhooks** and check the domain's endpoints: at least one must be switched on, not **Paused**. Use **Test** on the endpoint to confirm it answers `2xx`; the result shows the HTTP status and how long the delivery took, as the [webhook setup](/setup/webhooks) covers. Make your handler return `200` fast, then do slow work asynchronously so you stay inside the timeout. Because a single delivery can always be lost, treat the [History API](/api/server-api) as the guaranteed read: look the result up by `request_id` whenever it must not be missed.
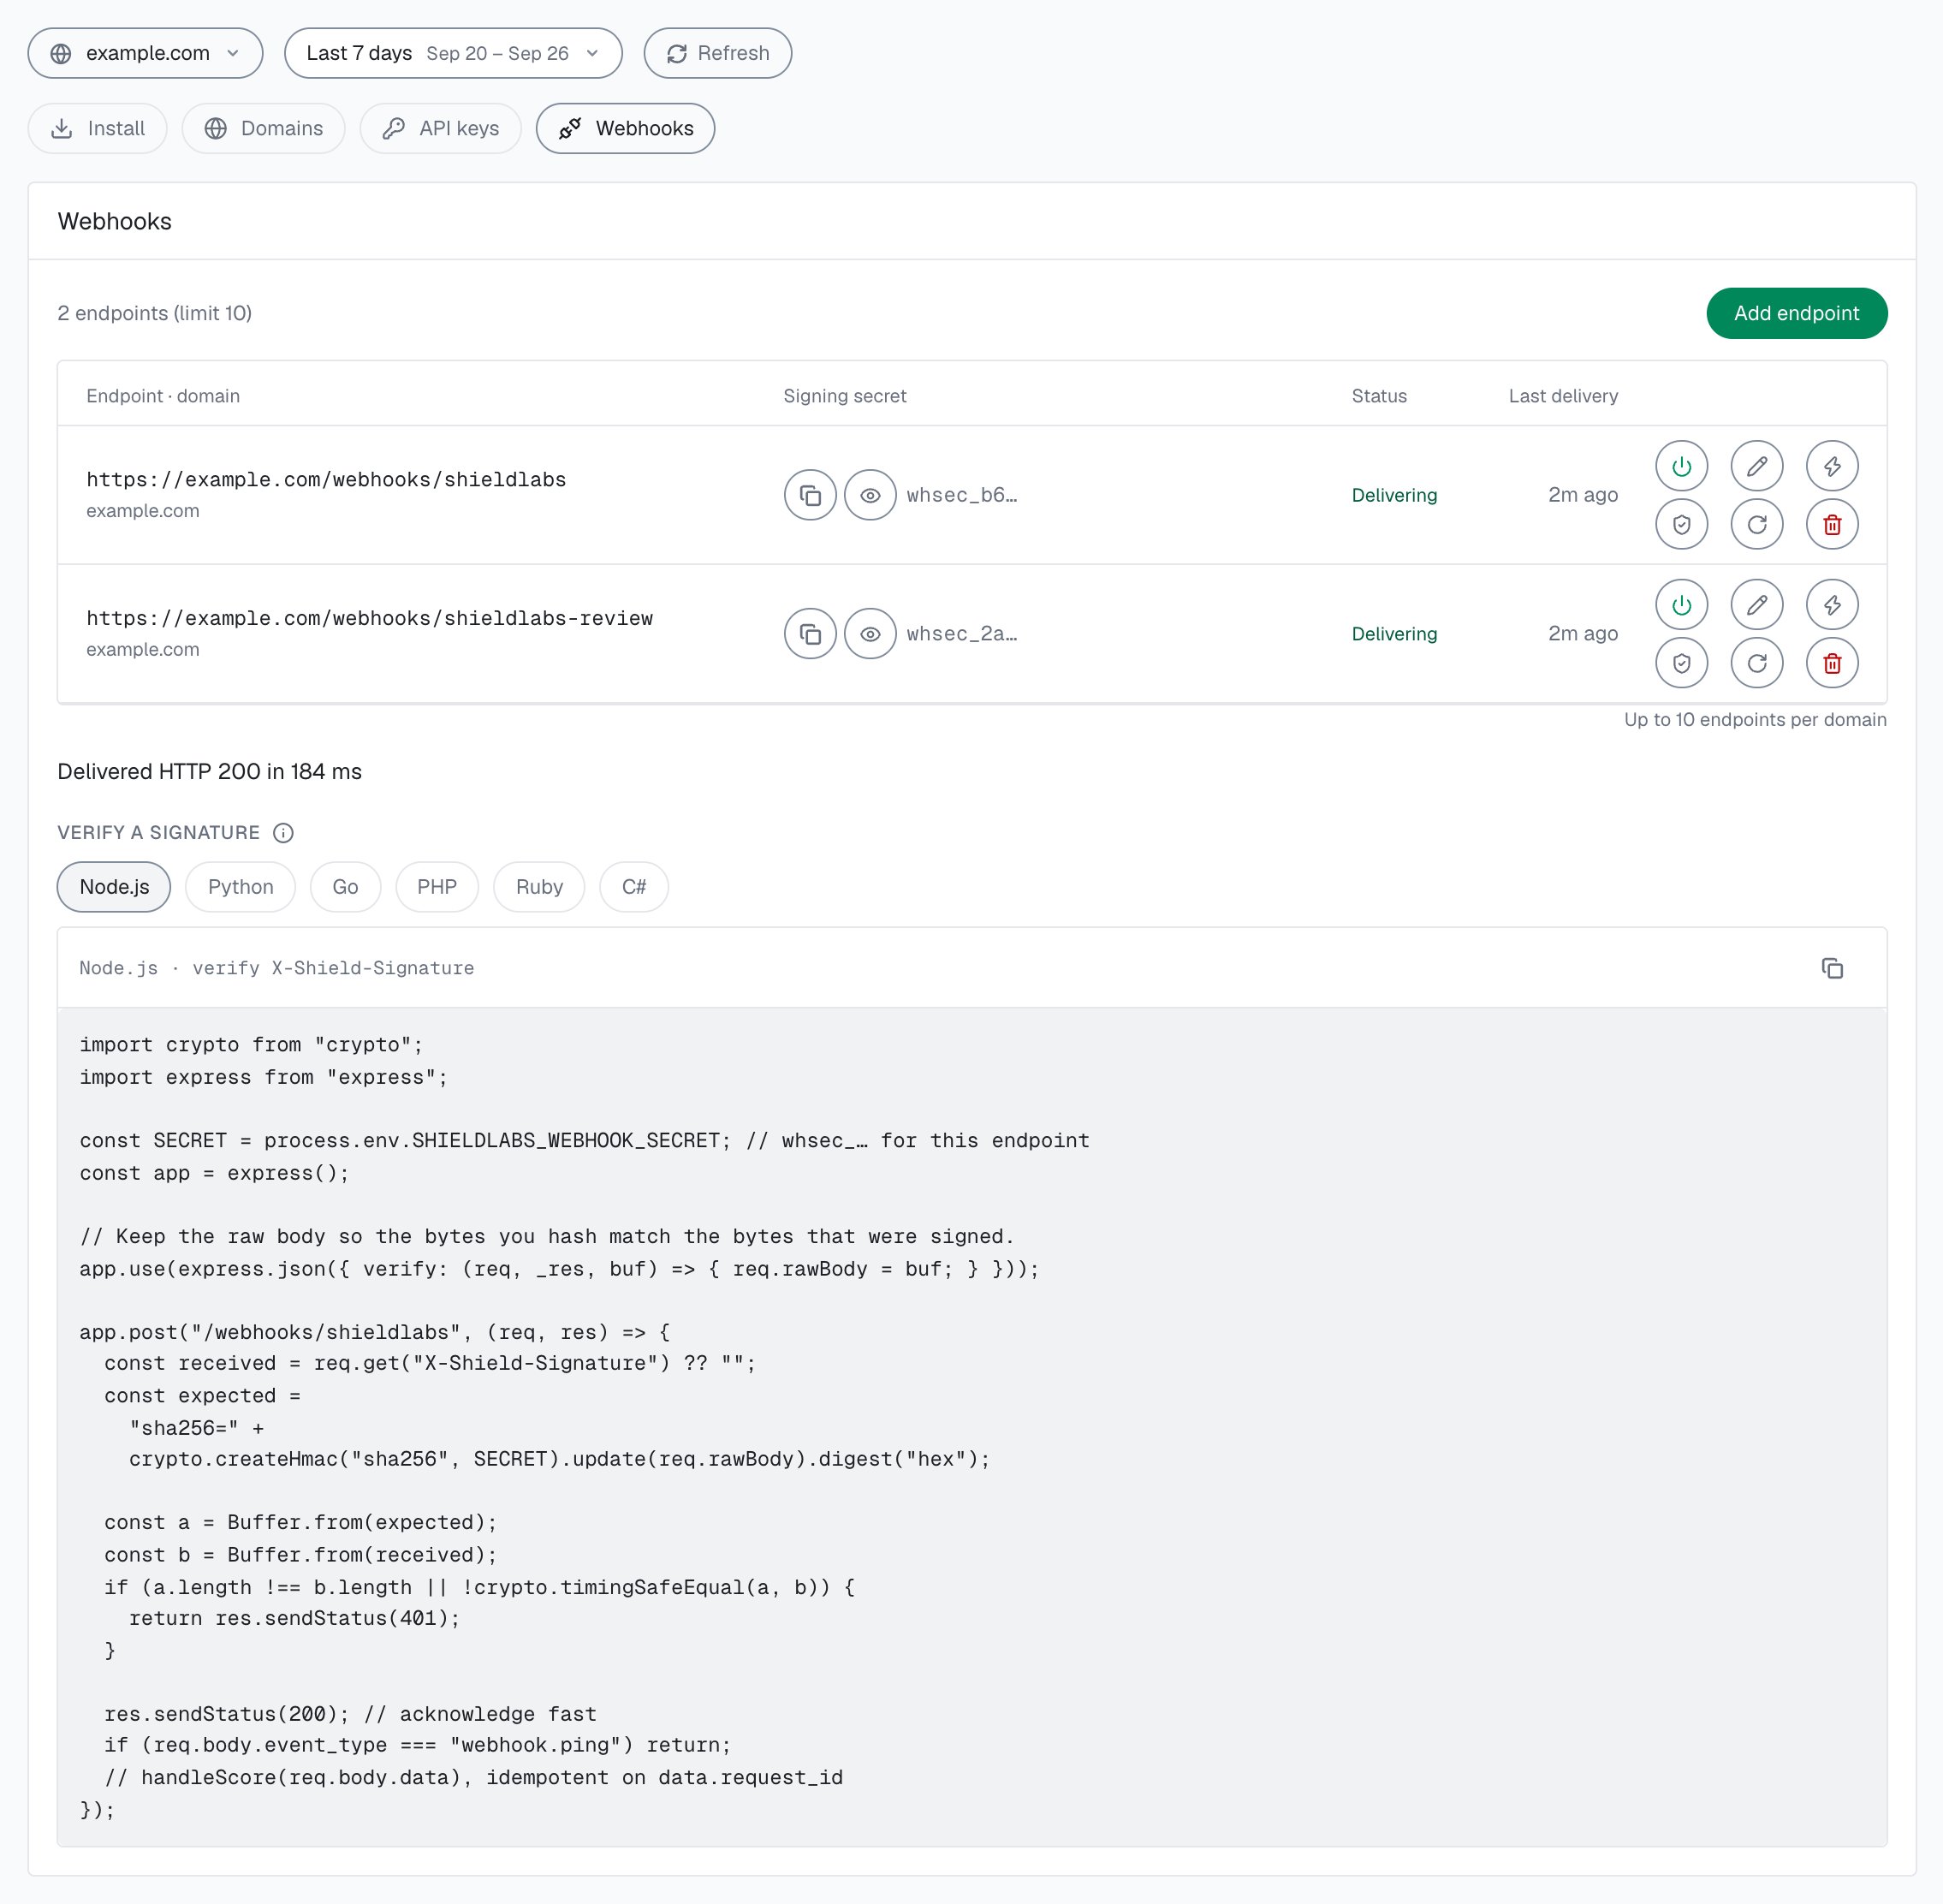
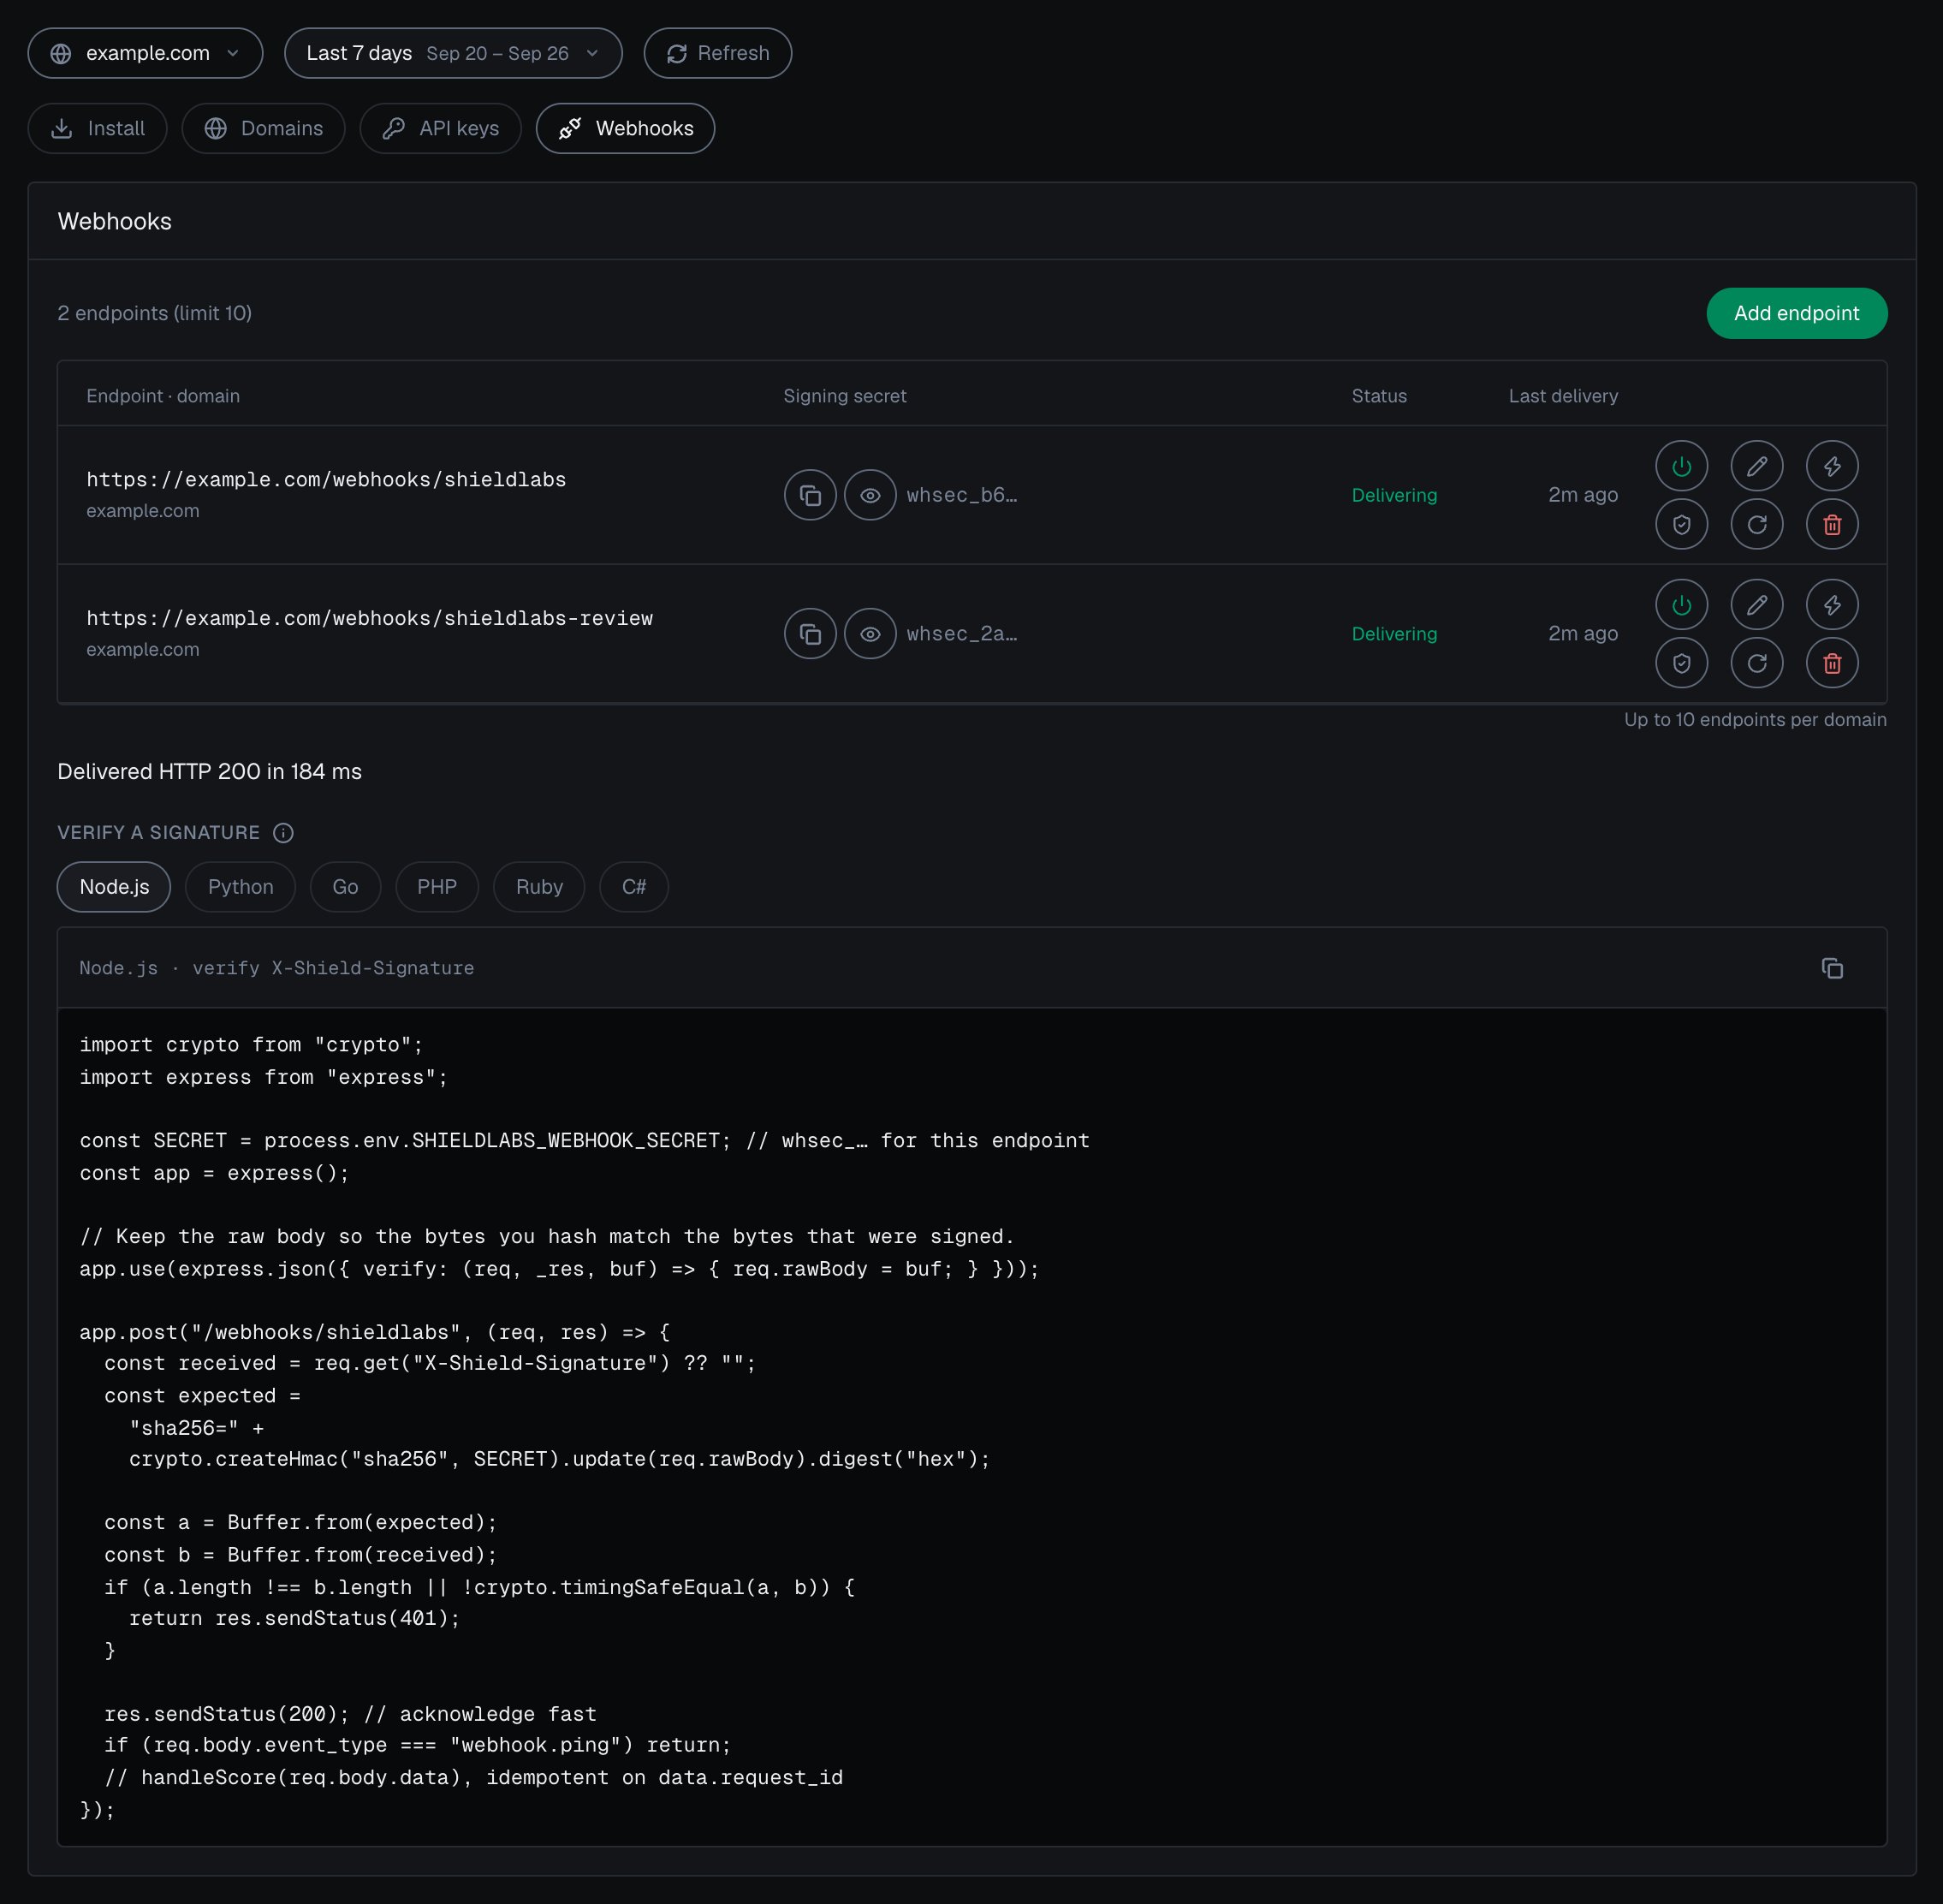 **Symptom.** The payload looks correct, but your HMAC check rejects it.
**Cause.** You are hashing a re-serialized copy of the JSON, or using the domain Secret Key instead of the endpoint's `whsec_…` secret. Parsing the body and re-encoding changes the bytes, so the HMAC no longer matches.
**Fix.** Compute HMAC-SHA256 over the **raw request body bytes exactly as received**, keyed with that endpoint's `whsec_…` signing secret, prefix with `sha256=`, and constant-time compare against `X-Shield-Signature`. The [webhook setup](/setup/webhooks) page has working Node, Go, and Python examples that do this correctly.
## Reading the result
**Symptom.** An identification carries a `device_id` of `00000000-0000-0000-0000-000000000000`.
**Cause.** An all-zero Device ID means no usable device signals reached ShieldLabs for that identification; the rate-limit marker (Risk Score `999`) is one such case.
**Fix.** Route it to review rather than allowing it. Read its risk signals and the account's other identifications by `user_hid` through the [History API](/api/server-api#read-every-identification-of-one-account). A `999` row is the gateway's rate-limit marker, so keep it out of Risk Score logic (see the `429` entry below). The [Identifiers](/features/identification) page covers the all-zero case.
**Symptom.** A real customer lands in the Suspicious or Dangerous band with no wrongdoing.
**Cause.** A corporate VPN, a proxy, or a privacy-focused browser raises the Risk Score on its own. The signals are real, but they describe the connection, not the person's intent.
**Fix.** Read a high Risk Score together with its named risk signals and the user's history. A real customer on a corporate VPN can reach the Suspicious band; the signals show why, and you choose the action for each case. Check the account too: its other identifications (History API by `user_hid`), its linked devices and IPs, and whether a High-Risk Event is on it, in the analytics dashboard, the API or webhooks. A withdrawal warrants a stricter line than a page view. The guide to [acting on results](/guides/acting-on-risk-score) walks through the three bands (Trusted 0-29, Suspicious 30-59, Dangerous 60-100) and adjusting your cut-offs gradually so legitimate VPN users keep access.
**Symptom.** You want the history of an account, device, visitor or IP, or its earliest and latest sighting.
**Cause.** The [History API](/api/server-api) returns identifications, newest first, each with its `created_at` time. First and last activity come from the two ends of that list.
**Fix.** Read the History API by `user_hid`, `device_id`, `visitor_id` or `ip`. The first row is the most recent activity; page with `limit` (1 to 100) and `offset` to the last row for the earliest one stored. Reads never count toward your plan. In the analytics dashboard, every user, device, visitor and public IP [card](/dashboard/entity-card) shows **First seen** and **Last seen** for the selected period.
**Symptom.** Identifications arrive, but every one carries a `user_hid` of `"anonymous"`, and your users carry no High-Risk Events.
**Cause.** Your pages call `checkAnonymous` only, so no identification carries a User HID. Users, account-level risk and all four High-Risk Events are built on the User HID.
**Fix.** Pass a hashed User HID with `checkAuthenticatedUser` on every signed-in page, and call `forceCheckAuthenticatedUser(hashedUserId)` right after login, with a hashed or pseudonymous account id. The [snippet](/setup/snippet#identify-signed-in-users) page shows the signed-in call. An event also needs its evidence: by default, Multi-accounting fires from 3 accounts on one visitor (one device plus one cookie) and Account sharing from 4 devices on one account, and both thresholds are configurable.
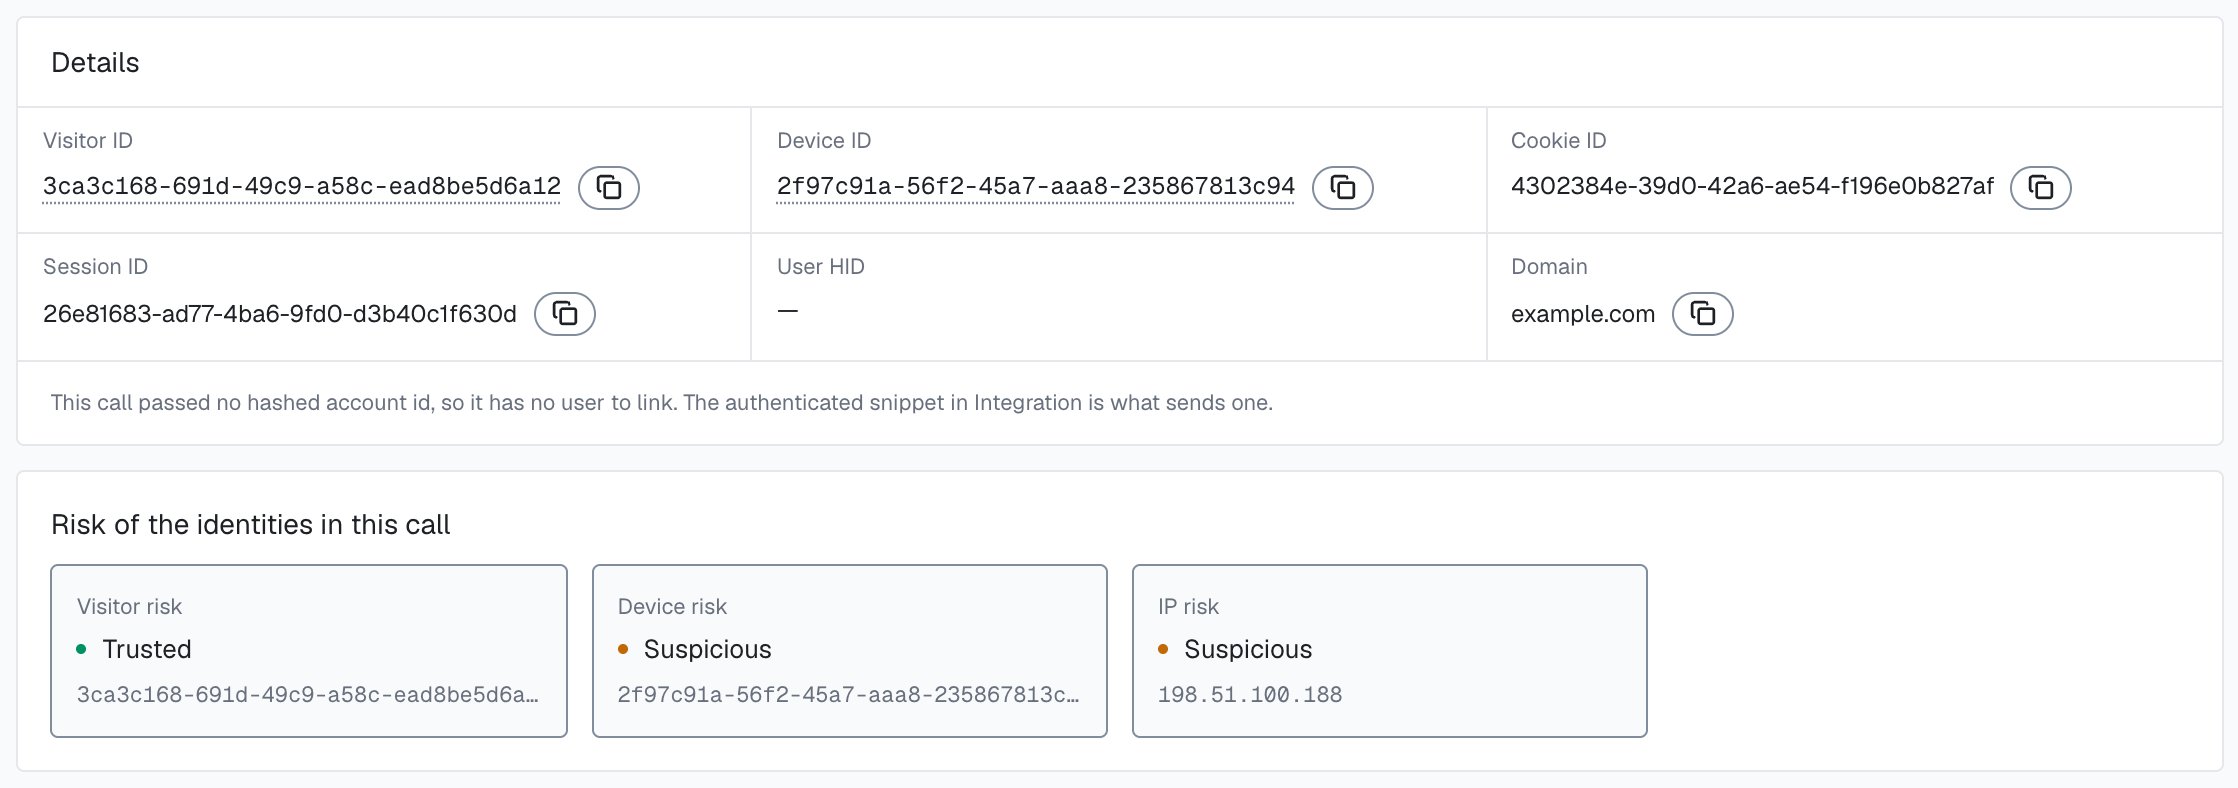
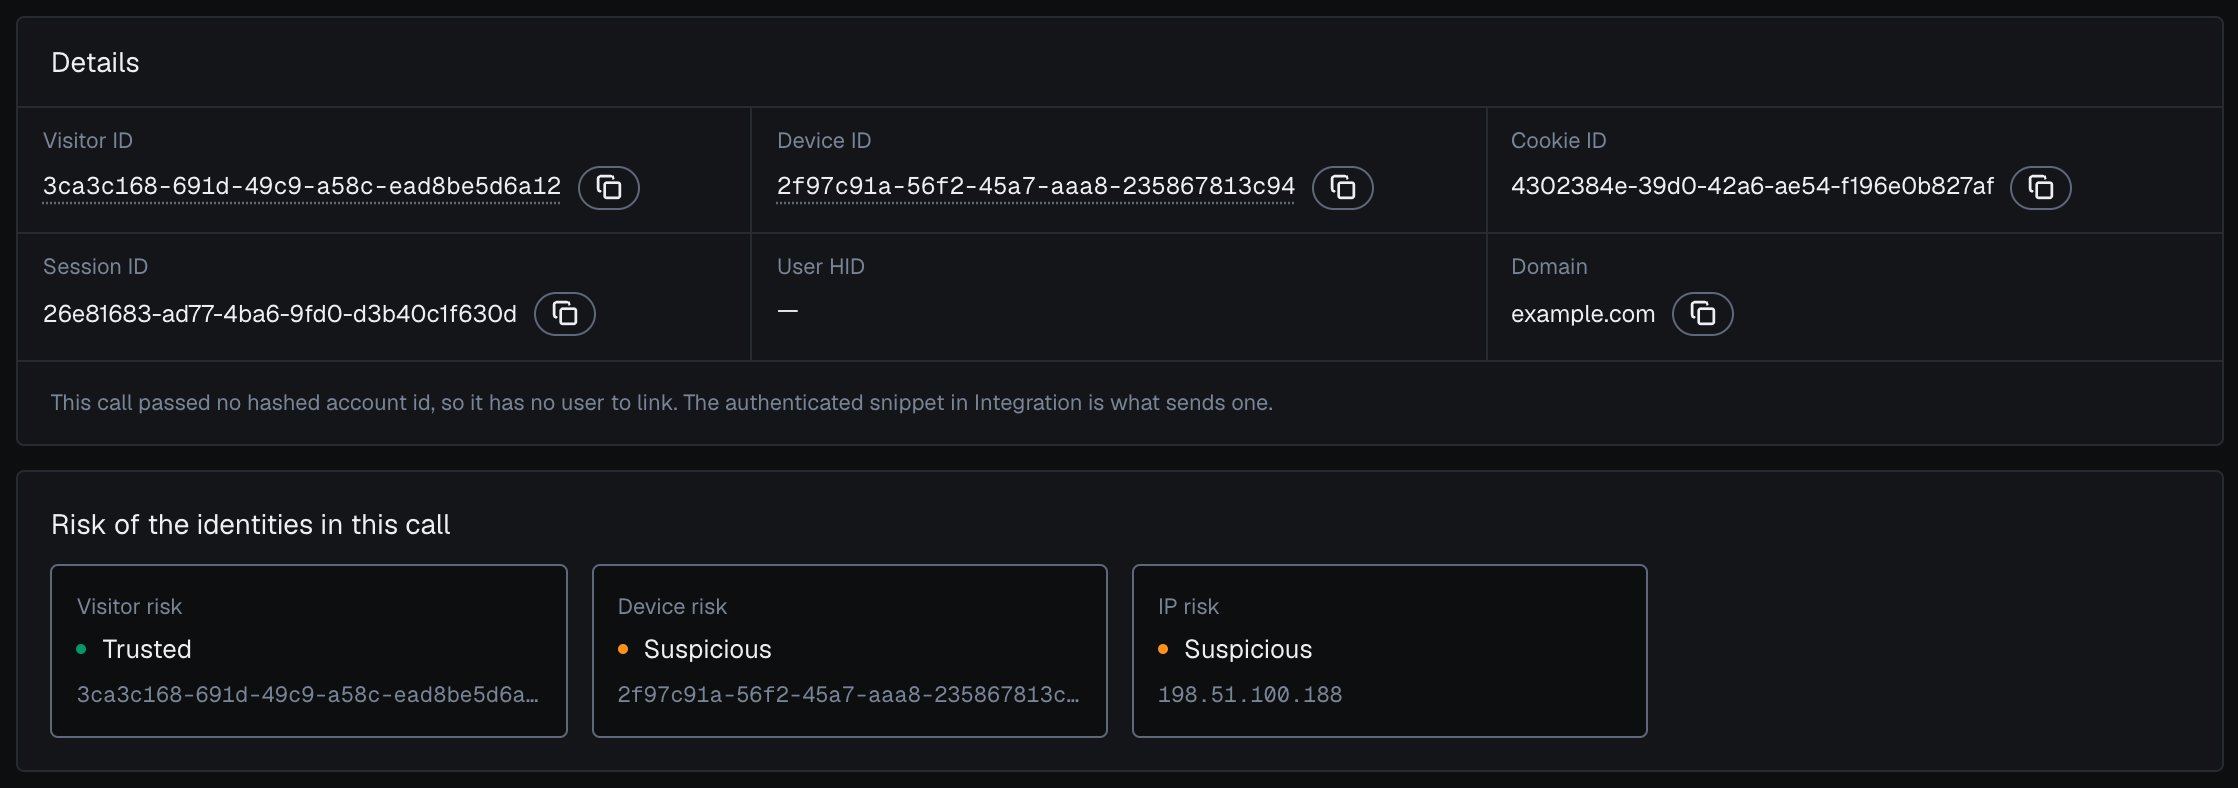
To check one call, open its [identification card](/dashboard/identification-card): a note under **Details** says when the call passed no User HID and so has no user to link, and **Risk of the identities in this call** shows no User risk.
**Symptom.** The payload looks correct, but your HMAC check rejects it.
**Cause.** You are hashing a re-serialized copy of the JSON, or using the domain Secret Key instead of the endpoint's `whsec_…` secret. Parsing the body and re-encoding changes the bytes, so the HMAC no longer matches.
**Fix.** Compute HMAC-SHA256 over the **raw request body bytes exactly as received**, keyed with that endpoint's `whsec_…` signing secret, prefix with `sha256=`, and constant-time compare against `X-Shield-Signature`. The [webhook setup](/setup/webhooks) page has working Node, Go, and Python examples that do this correctly.
## Reading the result
**Symptom.** An identification carries a `device_id` of `00000000-0000-0000-0000-000000000000`.
**Cause.** An all-zero Device ID means no usable device signals reached ShieldLabs for that identification; the rate-limit marker (Risk Score `999`) is one such case.
**Fix.** Route it to review rather than allowing it. Read its risk signals and the account's other identifications by `user_hid` through the [History API](/api/server-api#read-every-identification-of-one-account). A `999` row is the gateway's rate-limit marker, so keep it out of Risk Score logic (see the `429` entry below). The [Identifiers](/features/identification) page covers the all-zero case.
**Symptom.** A real customer lands in the Suspicious or Dangerous band with no wrongdoing.
**Cause.** A corporate VPN, a proxy, or a privacy-focused browser raises the Risk Score on its own. The signals are real, but they describe the connection, not the person's intent.
**Fix.** Read a high Risk Score together with its named risk signals and the user's history. A real customer on a corporate VPN can reach the Suspicious band; the signals show why, and you choose the action for each case. Check the account too: its other identifications (History API by `user_hid`), its linked devices and IPs, and whether a High-Risk Event is on it, in the analytics dashboard, the API or webhooks. A withdrawal warrants a stricter line than a page view. The guide to [acting on results](/guides/acting-on-risk-score) walks through the three bands (Trusted 0-29, Suspicious 30-59, Dangerous 60-100) and adjusting your cut-offs gradually so legitimate VPN users keep access.
**Symptom.** You want the history of an account, device, visitor or IP, or its earliest and latest sighting.
**Cause.** The [History API](/api/server-api) returns identifications, newest first, each with its `created_at` time. First and last activity come from the two ends of that list.
**Fix.** Read the History API by `user_hid`, `device_id`, `visitor_id` or `ip`. The first row is the most recent activity; page with `limit` (1 to 100) and `offset` to the last row for the earliest one stored. Reads never count toward your plan. In the analytics dashboard, every user, device, visitor and public IP [card](/dashboard/entity-card) shows **First seen** and **Last seen** for the selected period.
**Symptom.** Identifications arrive, but every one carries a `user_hid` of `"anonymous"`, and your users carry no High-Risk Events.
**Cause.** Your pages call `checkAnonymous` only, so no identification carries a User HID. Users, account-level risk and all four High-Risk Events are built on the User HID.
**Fix.** Pass a hashed User HID with `checkAuthenticatedUser` on every signed-in page, and call `forceCheckAuthenticatedUser(hashedUserId)` right after login, with a hashed or pseudonymous account id. The [snippet](/setup/snippet#identify-signed-in-users) page shows the signed-in call. An event also needs its evidence: by default, Multi-accounting fires from 3 accounts on one visitor (one device plus one cookie) and Account sharing from 4 devices on one account, and both thresholds are configurable.
To check one call, open its [identification card](/dashboard/identification-card): a note under **Details** says when the call passed no User HID and so has no user to link, and **Risk of the identities in this call** shows no User risk.
 ## Status codes and limits
**Symptom.** The snippet's identification request returns `402`.
**Cause.** Your account has used its included volume. Only the identification request returns `402`; History API and profile reads never do.
**Fix.** Identification resumes when the billing cycle resets or when you change plan, as the [Billing](/billing) page lays out. A `402` is a billing state and is unrelated to rate limiting.
**Symptom.** The gateway returns `429`, or a webhook or History row arrives with a Risk Score of `999` (`data.risk_score` on the webhook, `score` on the History API).
**Cause.** A `429` is a gateway protection, separate from the Risk Score. It can come from the per-IP limit (15/min, then a 10-minute ban), the per-domain ingest budget, or a **domain freeze** after 10 seconds at the plan cap. Only the **per-IP ban** can also surface a `999` marker on a webhook delivery or a History row. A domain freeze uses the same `429` body, is not billed, and does **not** emit `999`.
**Fix.** After verifying `X-Shield-Signature`, check for the marker before your decision logic: treat any value above 100 as the rate-limit marker and route the action it belongs to to review.
```js theme={null}
// After verifying X-Shield-Signature on the raw body and acknowledging with 200.
// 999 is the rate-limit ban marker, not a Risk Score: keep it out of your
// Risk Score logic and send the action it belongs to for review.
const data = req.body.data;
if (data.risk_score > 100) return routeToReview(data.request_id); // History API rows: row.score
```
The Risk Score is 0 to 100; the only exception is the `999` marker, which means "this IP was banned at the gateway." Soft domain `429`s and a domain freeze do not write `999`. The limits are on the [rate limits](/rate-limits) page.
**Symptom.** You want a liveness probe for monitoring or a load balancer health check.
**Cause.** You need a lightweight endpoint that confirms a gateway is serving, without counting toward your plan or running a scoring path.
**Fix.** Each gateway exposes a `GET /health` endpoint that returns `200` with `{ "status": "ok" }`. Point your uptime monitor or orchestrator liveness probe at it. It needs no key and never counts toward your plan.
## Still stuck
If a status code is the question, the [Errors](/errors) page is the full per-surface reference, and the [FAQ](/faq) answers the questions developers ask most about keys, identifications, identifiers and a Risk Score of 0. [Support](/support) is there by chat and email on every plan.
This documentation is built and hosted on [Mintlify](https://mintlify.com), a developer documentation platform.
## Status codes and limits
**Symptom.** The snippet's identification request returns `402`.
**Cause.** Your account has used its included volume. Only the identification request returns `402`; History API and profile reads never do.
**Fix.** Identification resumes when the billing cycle resets or when you change plan, as the [Billing](/billing) page lays out. A `402` is a billing state and is unrelated to rate limiting.
**Symptom.** The gateway returns `429`, or a webhook or History row arrives with a Risk Score of `999` (`data.risk_score` on the webhook, `score` on the History API).
**Cause.** A `429` is a gateway protection, separate from the Risk Score. It can come from the per-IP limit (15/min, then a 10-minute ban), the per-domain ingest budget, or a **domain freeze** after 10 seconds at the plan cap. Only the **per-IP ban** can also surface a `999` marker on a webhook delivery or a History row. A domain freeze uses the same `429` body, is not billed, and does **not** emit `999`.
**Fix.** After verifying `X-Shield-Signature`, check for the marker before your decision logic: treat any value above 100 as the rate-limit marker and route the action it belongs to to review.
```js theme={null}
// After verifying X-Shield-Signature on the raw body and acknowledging with 200.
// 999 is the rate-limit ban marker, not a Risk Score: keep it out of your
// Risk Score logic and send the action it belongs to for review.
const data = req.body.data;
if (data.risk_score > 100) return routeToReview(data.request_id); // History API rows: row.score
```
The Risk Score is 0 to 100; the only exception is the `999` marker, which means "this IP was banned at the gateway." Soft domain `429`s and a domain freeze do not write `999`. The limits are on the [rate limits](/rate-limits) page.
**Symptom.** You want a liveness probe for monitoring or a load balancer health check.
**Cause.** You need a lightweight endpoint that confirms a gateway is serving, without counting toward your plan or running a scoring path.
**Fix.** Each gateway exposes a `GET /health` endpoint that returns `200` with `{ "status": "ok" }`. Point your uptime monitor or orchestrator liveness probe at it. It needs no key and never counts toward your plan.
## Still stuck
If a status code is the question, the [Errors](/errors) page is the full per-surface reference, and the [FAQ](/faq) answers the questions developers ask most about keys, identifications, identifiers and a Risk Score of 0. [Support](/support) is there by chat and email on every plan.
This documentation is built and hosted on [Mintlify](https://mintlify.com), a developer documentation platform.