> ## Documentation Index
> Fetch the complete documentation index at: https://docs.shieldlabs.ai/llms.txt
> Use this file to discover all available pages before exploring further.
# Traffic Quality by Source
> Rank channels, referrers and campaigns by the risky users, devices and traffic they bring.
Standard analytics measures **volume**: how many sessions, pageviews and "new" users. It cannot tell you how much of that traffic is masked, spoofed, automated or coordinated, or how many real people are behind it. ShieldLabs scores the users, devices and visitors your sources bring, and every identification underneath with an explainable [Risk Score (0-100)](/features/risk-scoring) and named risk signals, so a noisy number like "10,000 visits" splits into people and devices you can trust and ones you cannot.
## What is traffic quality?
Traffic quality is how much of an acquisition source's traffic comes from real people on their own devices, versus devices and accounts that are masked, spoofed, automated or coordinated. A source can look healthy on volume alone while most of its clicks arrive over VPNs, proxies, datacenter IPs, anti-detect browsers or automation. ShieldLabs grades each identification with a Risk Score and named [risk signals](/features/risk-signals), rolls each user, device and visitor up to the worst band of its identifications, and breaks both down by channel, referrer and UTM campaign.
The count stays honest because every identification resolves to a Device ID, which holds through cleared cookies, incognito mode and IP changes. One machine churning cookies still counts as one device, so it cannot inflate a source's volume.
The Risk Score is **0-100** in three bands: **Trusted (0-29)**, **Suspicious (30-59)**, **Dangerous (60-100)**; the only value above 100 is the 999 rate-limit marker, which you leave out of reporting. The API returns only the number, so map it to a band in your reporting. Read a high Risk Score together with its named risk signals and the user's history. A real customer on a corporate VPN can reach the Suspicious band; the signals show why, and you choose the action for each case. For traffic-quality reporting you read the shape of the distribution across many identifications, where single cases wash out.
## How ShieldLabs grades a source
ShieldLabs grades a source at two layers:
* **The people and devices it brings.** Each user (by the User HID you pass), device and visitor carries the worst band of its identifications, so you can read a source as "how many of its devices and users are risky", not only "how many of its page loads are". One machine that reloads a landing page ten times is one device. [Users, devices, visitors and IPs](/concepts/entities) explains how these identities link.
* **The identifications underneath.** Each identification carries a Risk Score with every named risk signal and its weight, plus the channel, referrer and UTM attribution of the page it ran on.
ShieldLabs identifies bots, automated traffic and AI agents, and separates bad bots from good ones. Known search-engine crawlers carry `detection_flags.search_bot`, get a Risk Score of 0 and arrive on the **Search bot** channel: count them as good bots and leave them out of real-visitor counts. Automated browsers, the bad bots, raise `browser_automation`, and headless clients also raise `javascript_disabled`; either one lands the identification in the Dangerous band.
High-Risk Events are detected on the users a source brings, each at Medium or High confidence. A source whose signups show [Multi-accounting](/features/high-risk-events#multi-accounting) is bringing one person's farm of accounts, however clean its page loads look. High-Risk Events are available in the analytics dashboard, the API and webhooks.
## Volume vs quality, in one number
Pageview analytics treats every session as equal. ShieldLabs adds a risk dimension to every identification and rolls it up to the users and devices behind it, so the same 10,000 visits become a quality breakdown you can act on.
| | Standard analytics | ShieldLabs |
| - | - | - |
| What it counts | Sessions, pageviews | Users, devices and visitors, each with its worst band, over identifications that each carry a Risk Score |
| "10,000 visits" means | 10,000 equal sessions | A split across Trusted / Suspicious / Dangerous, and the distinct devices and users behind it |
| Sees VPN, proxy, Tor, anti-detect routing | No | Yes, as named risk signals in `signals` |
| Separates good bots from bad bots | Filters known bots from reports | Known search-engine crawlers carry `search_bot`; automated browsers raise `browser_automation` |
| Returning visitor after cleared cookies | Counted as new | Recognized by Device ID (same browser) |
| Per-source view | Volume and conversions | Volume, conversions, and the share of risky devices and users |
A campaign sending 95% Trusted traffic and one sending 40% Dangerous-band traffic can report identical visit counts in pageview analytics. The Risk Score, and the devices and users behind it, are what tell them apart.
The three bands map directly to a quality report:
| Band | Risk Score | What usually lands in it |
| - | - | - |
| **Trusted** | 0-29 | Direct connections and ordinary browsers; a VPN, privacy relay, proxy, datacenter IP or timezone mismatch on its own (a weight of 10 to 15 each) |
| **Suspicious** | 30-59 | A browser VPN or proxy extension, an OS that could not be detected, a network check that did not complete, or several lighter signals stacked |
| **Dangerous** | 60-100 | Tor, JavaScript disabled, OS mismatch, an anti-detect browser, browser automation |
A source's Trusted share can still carry masked traffic, so read the `vpn` and `proxy` flags per source as well as the bands.
The split is driven by the named [risk signals](/features/risk-signals): **Tor**, **JavaScript Disabled**, **OS Mismatch**, **Anti-detect Browser**, **Browser Automation**, **Browser VPN/Proxy**, **VPN**, **Privacy Relay**, **Proxy**, **Datacenter IP**, **Abuser Flag**, **Timezone Mismatch** and the rest. Each arrives in the webhook `signals` array by slug with the points it added, and as a boolean in [`detection_flags`](/glossary#detection-flags).
One comparison earns special attention for reporting. The webhook carries two IP objects. `public_ip` is the public address and its country, which a VPN or proxy can put anywhere. `local_ip` is the Local IP: the address the browser itself reports, which can differ from the public IP behind a VPN or proxy and can expose the network behind the mask. `local_ip.ip` is empty when the Local IP was not captured. `detection_flags.ip_mismatch` is `true` whenever the two are different addresses. It is informational, adds nothing to the Risk Score and can be ordinary on mobile networks, so compare `local_ip.country` with `public_ip.country` rather than branching on the flag alone. A source whose identifications routinely show `public_ip.country` differing from `local_ip.country` is sending masked traffic, however clean the public IP looks.
## Grade and act on each source
The whole workflow is three plain steps. ShieldLabs grades every user, device and identification; you set the grading line and make the budget call.
1. **Read the risky share per source.** For each channel, referrer and UTM campaign, read the share of its devices and users whose worst band is Suspicious or Dangerous, and the share of its identifications in those bands. That share is the source's risk grade.
2. **Rank and flag sources by that share.** Sort worst-first. Flag any source whose share crosses a line you set; a low share marks a source you trust as-is.
3. **Turn the grade into a budget decision.** Divide each source's spend by its trusted devices (distinct Device IDs whose worst band is Trusted), not its raw click count, to get cost per real visitor. Cut or renegotiate the sources paying click prices for masked or automated traffic, keep the ones that look pricey per click but bring mostly Trusted devices and users, and report real-visitor numbers instead of raw volume.
A few cases worth flagging while you grade:
* A channel or campaign with a high Dangerous share is the first place to cut or renegotiate, especially affiliate and referral sources.
* A source that looks expensive per click but brings mostly Trusted devices may be your best traffic once reweighted to cost per real visitor.
* Rising Suspicious and Dangerous share over time on Direct or Organic Search is a cue to check the users that source brings for [High-Risk Events](/features/high-risk-events) such as Multi-accounting.
## Build it
Reading traffic quality is part analytics dashboard, part export or webhook feed. The snippet feeds all of them; the first step is the only code you need.
Add the [snippet](/setup/snippet) to the page that receives the traffic. It records the channel, referrer and UTM attribution of every identification from the page it runs on, and the webhook carries them in `traffic_source`: `channel`, `referrer_domain`, `landing_url`, `utm_source`, `utm_medium`, `utm_campaign`, `utm_content`, `utm_term` and `click_id_type`. Make sure your UTM parameters are on the inbound links. On signed-in pages, call `checkAuthenticatedUser` with the hashed User HID, so the report can count the accounts behind each source. The [CSP](/setup/csp) page lists the header requirements.
Within one visit (while a page of your site stays open in the browser, across route changes in a single-page app and across open tabs), `checkAnonymous` and `checkAuthenticatedUser` run at most one identification every five minutes for the same user. A call inside that window posts nothing, counts nothing, and its `onInitialized` handler receives `{ status: "not_initialized" }`, so route changes and extra tabs within one visit add no identifications. On a multi-page site, a full page load in the only open tab can start a new visit with its own identification.
```html Landing page that paid and organic traffic arrives on theme={null}
```
On **Overview** in the [analytics dashboard](/dashboard/overview), pick the period and the domain, then read the **Traffic quality** gauge: the average Risk Score of the period's identifications, with its band, next to the **Identifications**, **Trusted**, **Suspicious** and **Dangerous** tiles. This is your quality split for all traffic at a glance. The **Users** and **Unique visitors** panels beside it show how many of the people behind that traffic are risky, and **Unique visitors** separates good bots from bad bots.

 On **Overview**, **Top channels** lists each channel with its identifications and average Risk Score. Open [Analytics](/dashboard/analytics) with a **Channel**, **Source** or **Campaign** filter and switch to the **Users** or **Devices** tab: the users and devices behind that source's identifications, each with its worst band in the period. Open a user to see its High-Risk Events. That isolates the single affiliate, creative or campaign that sends risky traffic inside an otherwise healthy channel. Channels are Google Ads, Meta, TikTok, LinkedIn, X, Pinterest, Microsoft Ads, Organic Search, Search bot, Referral, Direct and Other.
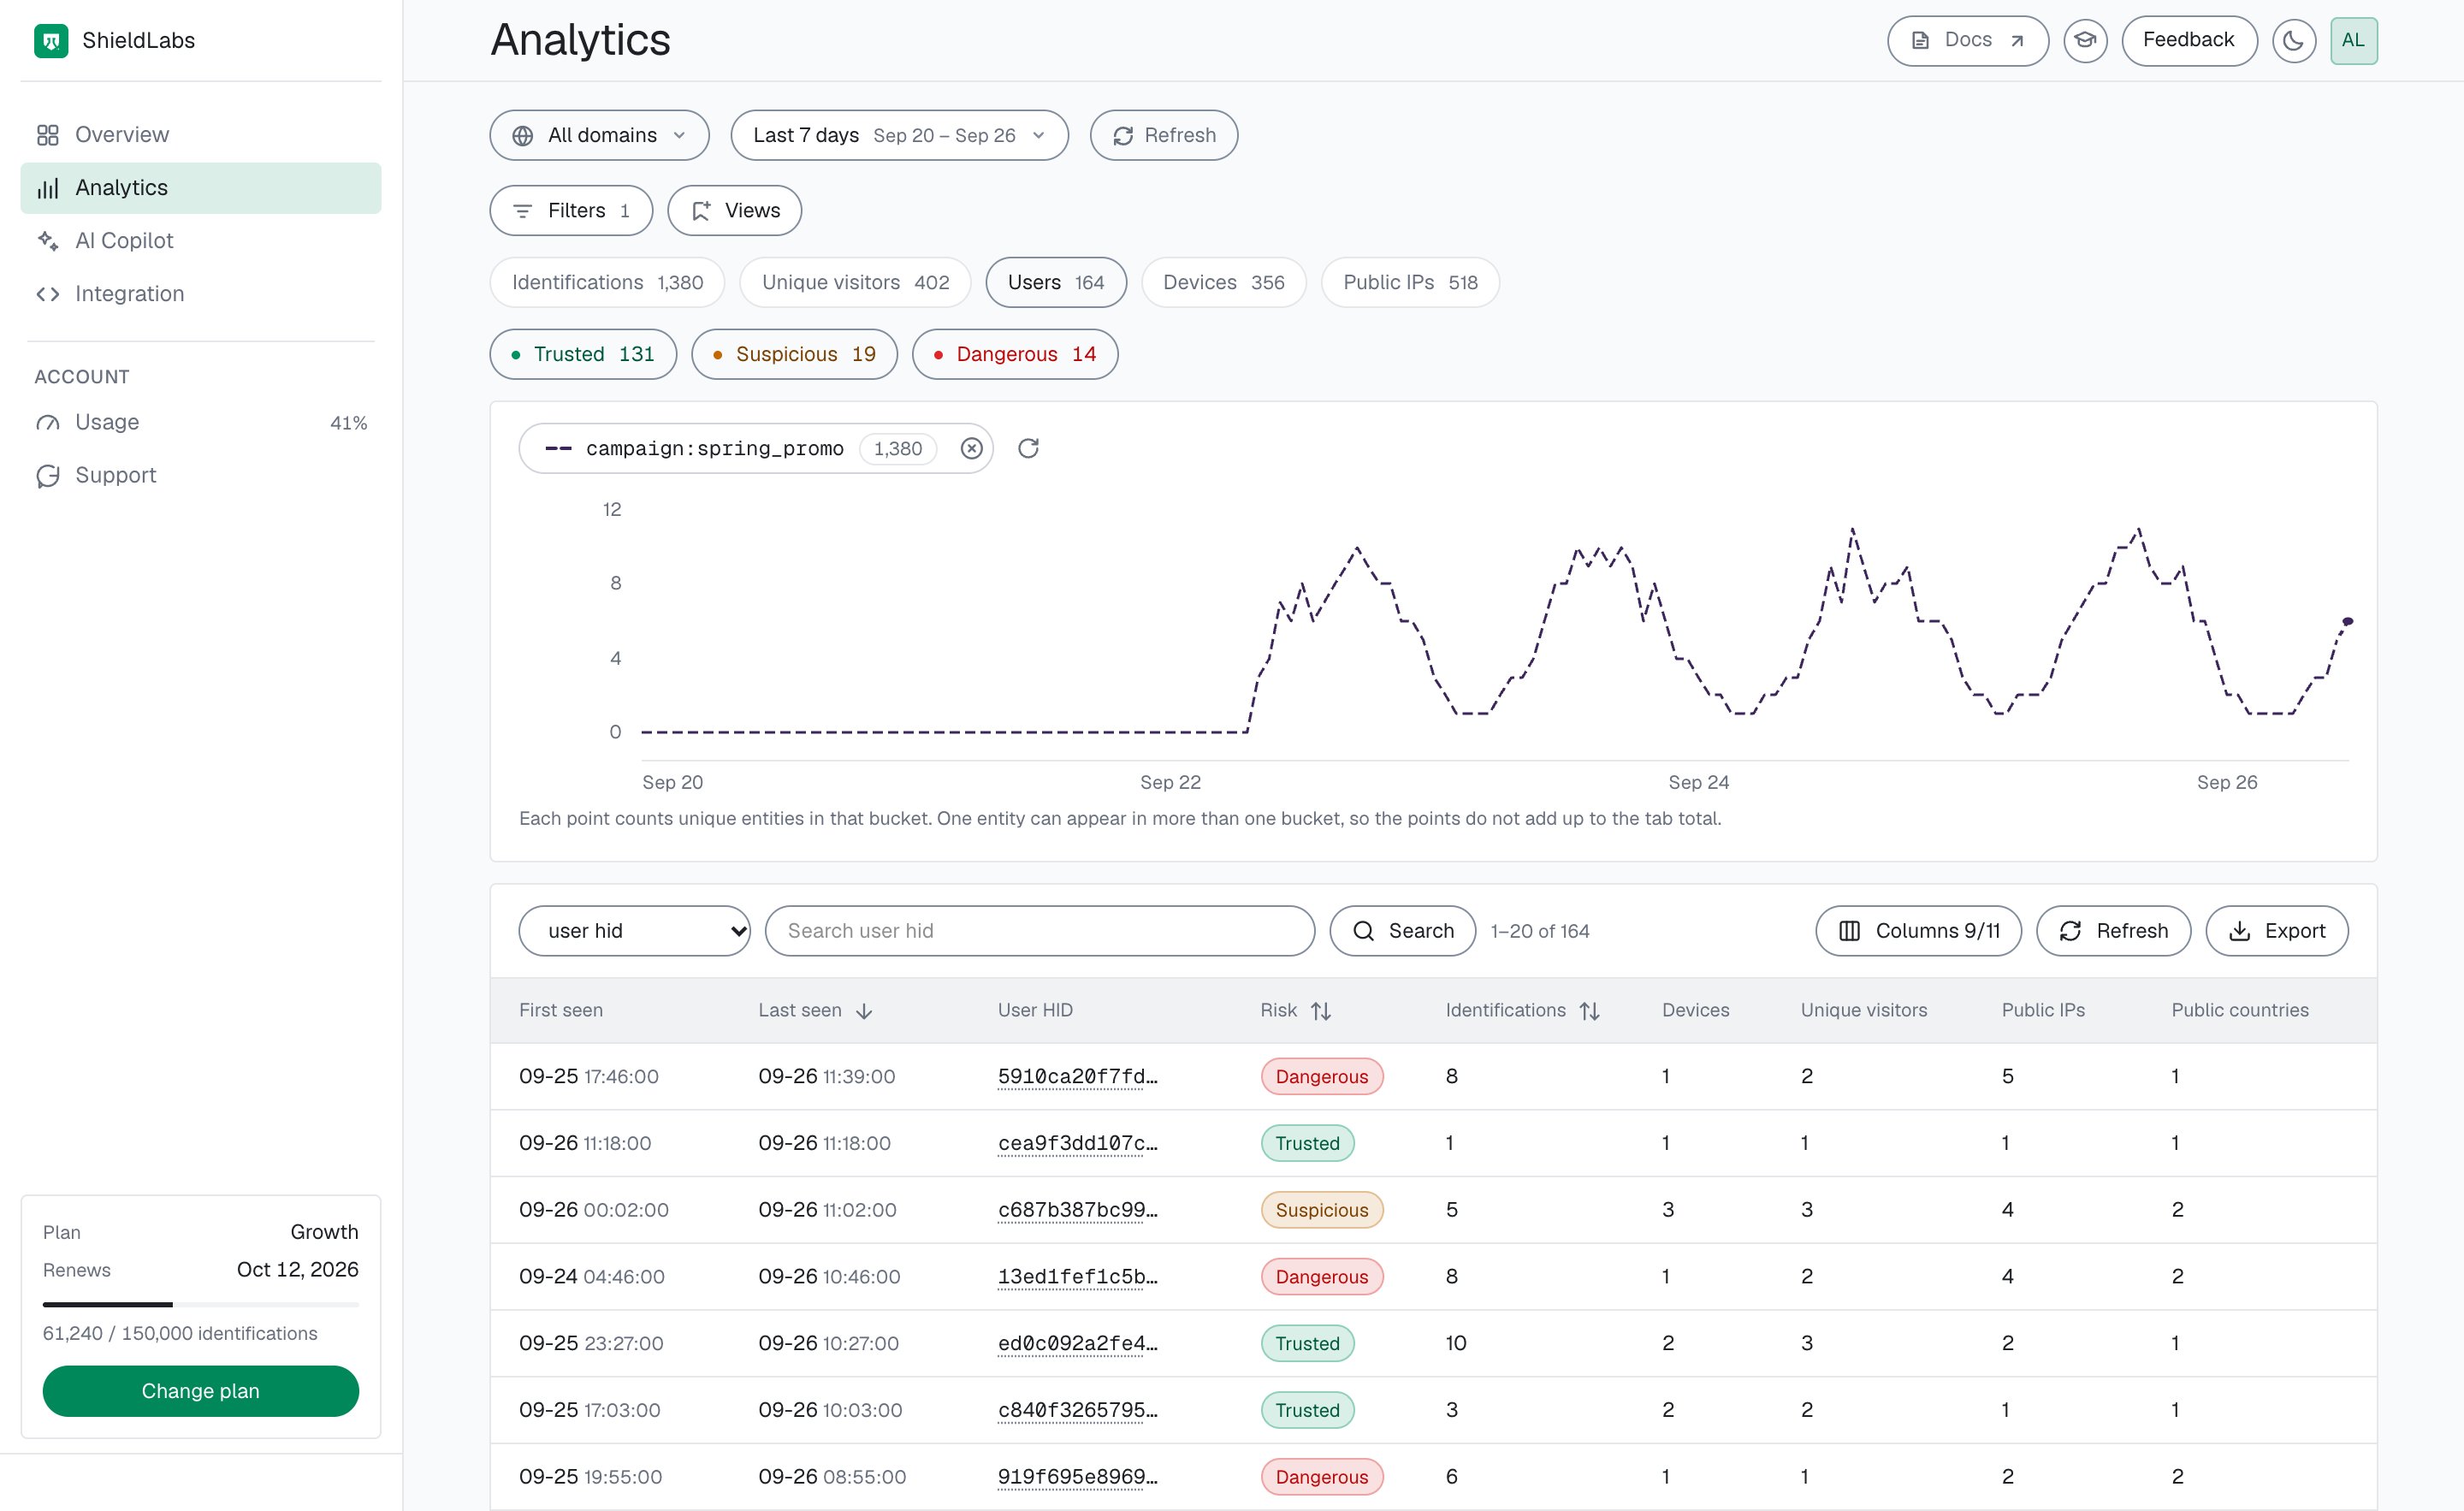
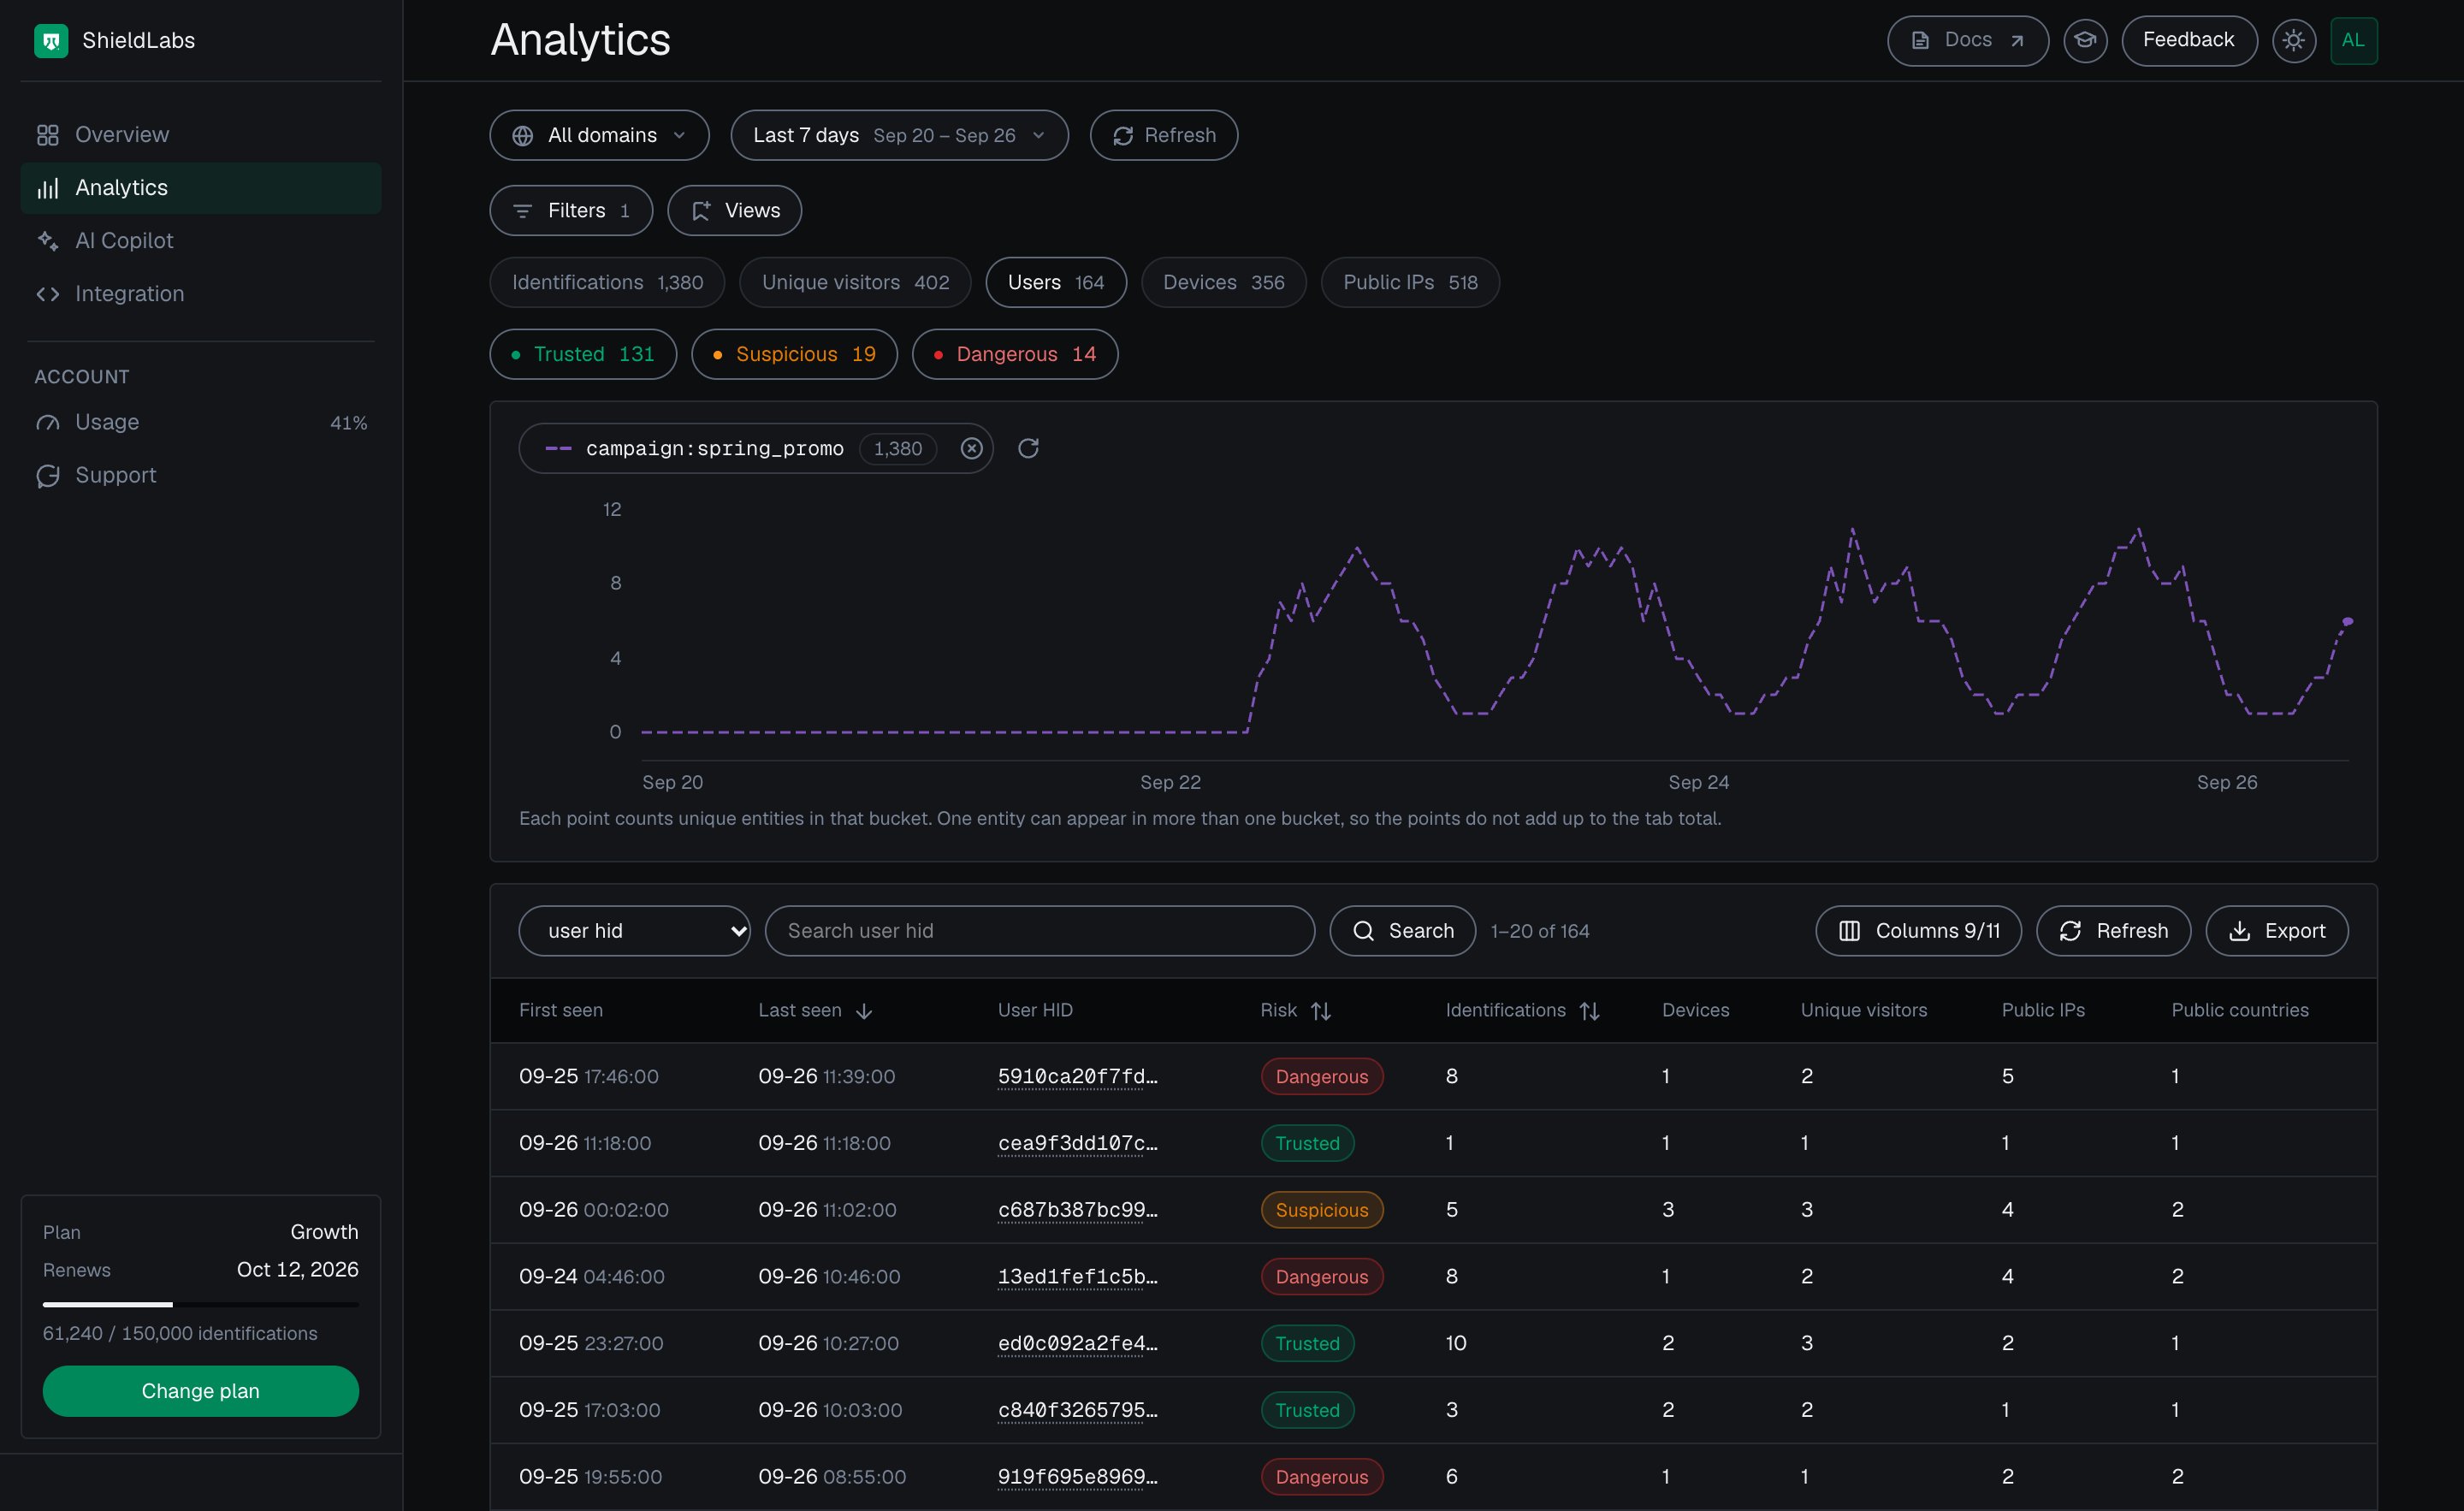 On [Analytics](/dashboard/analytics) in the analytics dashboard, pick the **Identifications** tab and use **Export**: the CSV holds every identification in the current filter, up to 10,000 rows. Exports never count against your included identifications. Each row carries the Risk Score, the risk signal flags and the traffic source, so you can join it against ad spend. For every identification as it happens, aggregate the webhook `traffic_source` object in your own store (see "Read identifications by identifier" below).
For per-source roll-ups, the boolean `detection_flags` (`vpn`, `proxy`, `tor`, `datacenter_ip`, `anti_detect_browser`, `browser_automation`, `suspicious_paid_click` and the rest) aggregate more cleanly than the variable-length `signals` array. `SUM` each flag grouped by `channel` or `utm_*` to get a masking and automation share per source.
Group the identifications by source and count each device once, at the worst Risk Score it showed from that source. Divide spend by the devices that stayed Trusted instead of the raw count. That stops you from paying click prices for masked or automated traffic.
```js theme={null}
// Grade sources from the webhook `data` objects you stored for one reporting
// window. `spend` per source comes from your ad platforms. `band` and
// NIL_DEVICE come from the shared helpers.
function gradeSources(identifications, spend) {
const bySource = new Map();
for (const d of identifications) {
if (d.risk_score > 100) continue; // the 999 rate-limit marker
if (d.detection_flags?.search_bot) continue; // good bots: known crawlers, Risk Score 0
const t = d.traffic_source ?? {};
const key = t.utm_campaign || t.channel || 'Other';
const s = bySource.get(key) ?? { identifications: 0, devices: new Map(), users: new Map() };
s.identifications += 1;
// Each device and each user keeps the worst Risk Score it showed from this source.
if (d.device_id && d.device_id !== NIL_DEVICE) {
s.devices.set(d.device_id, Math.max(s.devices.get(d.device_id) ?? 0, d.risk_score));
}
if (d.user_hid && d.user_hid !== 'anonymous') {
s.users.set(d.user_hid, Math.max(s.users.get(d.user_hid) ?? 0, d.risk_score));
}
bySource.set(key, s);
}
return [...bySource].map(([source, s]) => {
const trustedDevices = [...s.devices.values()].filter((v) => band(v) === 'Trusted').length;
const riskyUsers = [...s.users.values()].filter((v) => band(v) !== 'Trusted').length;
const cost = spend[source] ?? 0;
return {
source,
identifications: s.identifications,
devices: s.devices.size,
// null: no usable Device ID (or no signed-in user) arrived from this source.
riskyDeviceShare: s.devices.size ? 1 - trustedDevices / s.devices.size : null,
users: s.users.size,
riskyUserShare: s.users.size ? riskyUsers / s.users.size : null,
costPerClick: cost / Math.max(s.identifications, 1), // identifications stand in for clicks
costPerTrustedDevice: cost / Math.max(trustedDevices, 1),
};
});
}
// google_ads: $0.40/click, 6,200 devices, 5% risky -> $0.68 per trusted device
// affiliate_x: $0.33/click, 1,500 devices, 70% risky -> $6.67 per trusted device
```
On a cost-per-click basis a masked affiliate can look cheaper. On a cost-per-trusted-device basis it can cost several times more, because many of its clicks come from a few masked or automated devices. Counting each device once, at its worst band, keeps one machine that churns cookies from inflating a source. Attribution belongs to each identification, from the page it ran on, so an account counts toward a source when one of its identifications arrived from it; to credit signups made later on other pages, join them to the source through the Device ID that arrived from it.
For paid sources specifically, the webhook exposes a ready-made `suspicious_paid_click` flag in `detection_flags`, `true` for an identification on the Google Ads, Meta, TikTok, LinkedIn, X, Pinterest or Microsoft Ads channel (paid or organic) **with** a Risk Score of 60 or more, so you can sum it per `utm_campaign` or `channel` without re-deriving the channel-plus-score logic. Paying out conversions on top of this is covered in [Affiliate Fraud](/use-case/affiliate-fraud).
Traffic quality is computed over **identifications**, while [High-Risk Events](/features/high-risk-events) are counted per **user**. They use different denominators on purpose, so their totals do not reconcile. For "how risky is my traffic", read traffic quality; for "which users show Multi-accounting, Account sharing, Impossible travel or Account takeover", read High-Risk Events.
### Read identifications by identifier
The analytics dashboard and the export cover reporting. To read identifications by identifier, for example to reconcile or enrich a row, use the [History API](/api/server-api). It returns identifications newest first with `score`, `score_details`, `is_*` flags and network fields, and the traffic source as flat fields (`traffic_channel`, `referrer_domain`, `utm_source` and the other `utm_*` fields). History reads through `account.shieldlabs.ai` never count against your included identifications.
```bash theme={null}
# Identifications of one visitor, newest first.
curl "https://account.shieldlabs.ai/api/v1/history/visitor_id/c4a2e9b1-5f8d-4c3a-8e7b-2a1f0d9c8b76?limit=50" \
-H "Authorization: Bearer sec_your_private_api_key"
```
```json theme={null}
{
"data": [
{
"request_id": "8f1d0c2a-7b3e-4a9c-9d2f-1e6a5b4c3d21",
"visitor_id": "c4a2e9b1-5f8d-4c3a-8e7b-2a1f0d9c8b76",
"device_id": "a1b2c3d4-e5f6-4a7b-8c9d-0e1f2a3b4c5d",
"user_hid": "anonymous",
"ip": "203.0.113.42",
"country": "US",
"score": 70,
"score_details": "[{\"Value\":60,\"Description\":\"Browser Automation\"},{\"Value\":10,\"Description\":\"Is datacenter\"}]",
"browser": "Chrome",
"device_type": "desktop",
"traffic_channel": "Meta",
"utm_source": "facebook",
"utm_campaign": "spring_promo",
"created_at": "2026-06-16 10:00:21"
}
],
"total": 1
}
```
Parse `score_details` as JSON. Branch on `score` and each entry's `Value`, not on the human-readable `Description` label, which can change, and skip entries whose `Value` is 0.
If you would rather build the report in real time as traffic arrives, consume the [webhook](/setup/webhooks) and aggregate `risk_score` per `traffic_source.channel` or `utm_campaign`, and per Device ID, in your own store. Webhooks are at-most-once with no retries, so make the handler idempotent on `request_id` and reconcile against the History API for guaranteed completeness.
## Test it
Confirm the Device ID holds before you trust the quality split:
Visit a page with the snippet installed and read the webhook (or the [History API](/api/server-api)). Note the `device_id`.
Open the same page in a private window, then again after clearing cookies and storage. The `cookie_id` and `visitor_id` change, but the `device_id` stays the same: that is what keeps a returning visitor from counting as new.
Reconnect through a VPN or proxy and reload. The IP changes and a risk signal such as `vpn` or `proxy` appears in `signals`, while the `device_id` is unchanged. That is one device over masked traffic, exactly the case the quality report is built to surface.
**Unique visitors** in the analytics dashboard counts Visitor IDs, and a Visitor ID is one device plus one cookie; its **Good bots** and **Bad bots** tiles separate search-engine crawlers from automated browsers. For cost per real visitor, count Device IDs, which hold through cleared cookies. The [identifiers reference](/features/identification) has the full mechanics.
## Where to go next
If you have not installed the snippet and a webhook yet, start with the [Quickstart](/quickstart). To understand the Risk Score and the named risk signals behind the split, read [Risk Score](/features/risk-scoring) and [Risk signals](/features/risk-signals); [Traffic Analytics](/features/traffic-analytics) covers channels, referrers and campaigns in depth. Per-source payout decisions build on this in [Affiliate Fraud](/use-case/affiliate-fraud), and the [Billing](/billing) page covers the included identifications on each plan.
This documentation is built and hosted on [Mintlify](https://mintlify.com), a developer documentation platform.
On [Analytics](/dashboard/analytics) in the analytics dashboard, pick the **Identifications** tab and use **Export**: the CSV holds every identification in the current filter, up to 10,000 rows. Exports never count against your included identifications. Each row carries the Risk Score, the risk signal flags and the traffic source, so you can join it against ad spend. For every identification as it happens, aggregate the webhook `traffic_source` object in your own store (see "Read identifications by identifier" below).
For per-source roll-ups, the boolean `detection_flags` (`vpn`, `proxy`, `tor`, `datacenter_ip`, `anti_detect_browser`, `browser_automation`, `suspicious_paid_click` and the rest) aggregate more cleanly than the variable-length `signals` array. `SUM` each flag grouped by `channel` or `utm_*` to get a masking and automation share per source.
Group the identifications by source and count each device once, at the worst Risk Score it showed from that source. Divide spend by the devices that stayed Trusted instead of the raw count. That stops you from paying click prices for masked or automated traffic.
```js theme={null}
// Grade sources from the webhook `data` objects you stored for one reporting
// window. `spend` per source comes from your ad platforms. `band` and
// NIL_DEVICE come from the shared helpers.
function gradeSources(identifications, spend) {
const bySource = new Map();
for (const d of identifications) {
if (d.risk_score > 100) continue; // the 999 rate-limit marker
if (d.detection_flags?.search_bot) continue; // good bots: known crawlers, Risk Score 0
const t = d.traffic_source ?? {};
const key = t.utm_campaign || t.channel || 'Other';
const s = bySource.get(key) ?? { identifications: 0, devices: new Map(), users: new Map() };
s.identifications += 1;
// Each device and each user keeps the worst Risk Score it showed from this source.
if (d.device_id && d.device_id !== NIL_DEVICE) {
s.devices.set(d.device_id, Math.max(s.devices.get(d.device_id) ?? 0, d.risk_score));
}
if (d.user_hid && d.user_hid !== 'anonymous') {
s.users.set(d.user_hid, Math.max(s.users.get(d.user_hid) ?? 0, d.risk_score));
}
bySource.set(key, s);
}
return [...bySource].map(([source, s]) => {
const trustedDevices = [...s.devices.values()].filter((v) => band(v) === 'Trusted').length;
const riskyUsers = [...s.users.values()].filter((v) => band(v) !== 'Trusted').length;
const cost = spend[source] ?? 0;
return {
source,
identifications: s.identifications,
devices: s.devices.size,
// null: no usable Device ID (or no signed-in user) arrived from this source.
riskyDeviceShare: s.devices.size ? 1 - trustedDevices / s.devices.size : null,
users: s.users.size,
riskyUserShare: s.users.size ? riskyUsers / s.users.size : null,
costPerClick: cost / Math.max(s.identifications, 1), // identifications stand in for clicks
costPerTrustedDevice: cost / Math.max(trustedDevices, 1),
};
});
}
// google_ads: $0.40/click, 6,200 devices, 5% risky -> $0.68 per trusted device
// affiliate_x: $0.33/click, 1,500 devices, 70% risky -> $6.67 per trusted device
```
On a cost-per-click basis a masked affiliate can look cheaper. On a cost-per-trusted-device basis it can cost several times more, because many of its clicks come from a few masked or automated devices. Counting each device once, at its worst band, keeps one machine that churns cookies from inflating a source. Attribution belongs to each identification, from the page it ran on, so an account counts toward a source when one of its identifications arrived from it; to credit signups made later on other pages, join them to the source through the Device ID that arrived from it.
For paid sources specifically, the webhook exposes a ready-made `suspicious_paid_click` flag in `detection_flags`, `true` for an identification on the Google Ads, Meta, TikTok, LinkedIn, X, Pinterest or Microsoft Ads channel (paid or organic) **with** a Risk Score of 60 or more, so you can sum it per `utm_campaign` or `channel` without re-deriving the channel-plus-score logic. Paying out conversions on top of this is covered in [Affiliate Fraud](/use-case/affiliate-fraud).
Traffic quality is computed over **identifications**, while [High-Risk Events](/features/high-risk-events) are counted per **user**. They use different denominators on purpose, so their totals do not reconcile. For "how risky is my traffic", read traffic quality; for "which users show Multi-accounting, Account sharing, Impossible travel or Account takeover", read High-Risk Events.
### Read identifications by identifier
The analytics dashboard and the export cover reporting. To read identifications by identifier, for example to reconcile or enrich a row, use the [History API](/api/server-api). It returns identifications newest first with `score`, `score_details`, `is_*` flags and network fields, and the traffic source as flat fields (`traffic_channel`, `referrer_domain`, `utm_source` and the other `utm_*` fields). History reads through `account.shieldlabs.ai` never count against your included identifications.
```bash theme={null}
# Identifications of one visitor, newest first.
curl "https://account.shieldlabs.ai/api/v1/history/visitor_id/c4a2e9b1-5f8d-4c3a-8e7b-2a1f0d9c8b76?limit=50" \
-H "Authorization: Bearer sec_your_private_api_key"
```
```json theme={null}
{
"data": [
{
"request_id": "8f1d0c2a-7b3e-4a9c-9d2f-1e6a5b4c3d21",
"visitor_id": "c4a2e9b1-5f8d-4c3a-8e7b-2a1f0d9c8b76",
"device_id": "a1b2c3d4-e5f6-4a7b-8c9d-0e1f2a3b4c5d",
"user_hid": "anonymous",
"ip": "203.0.113.42",
"country": "US",
"score": 70,
"score_details": "[{\"Value\":60,\"Description\":\"Browser Automation\"},{\"Value\":10,\"Description\":\"Is datacenter\"}]",
"browser": "Chrome",
"device_type": "desktop",
"traffic_channel": "Meta",
"utm_source": "facebook",
"utm_campaign": "spring_promo",
"created_at": "2026-06-16 10:00:21"
}
],
"total": 1
}
```
Parse `score_details` as JSON. Branch on `score` and each entry's `Value`, not on the human-readable `Description` label, which can change, and skip entries whose `Value` is 0.
If you would rather build the report in real time as traffic arrives, consume the [webhook](/setup/webhooks) and aggregate `risk_score` per `traffic_source.channel` or `utm_campaign`, and per Device ID, in your own store. Webhooks are at-most-once with no retries, so make the handler idempotent on `request_id` and reconcile against the History API for guaranteed completeness.
## Test it
Confirm the Device ID holds before you trust the quality split:
Visit a page with the snippet installed and read the webhook (or the [History API](/api/server-api)). Note the `device_id`.
Open the same page in a private window, then again after clearing cookies and storage. The `cookie_id` and `visitor_id` change, but the `device_id` stays the same: that is what keeps a returning visitor from counting as new.
Reconnect through a VPN or proxy and reload. The IP changes and a risk signal such as `vpn` or `proxy` appears in `signals`, while the `device_id` is unchanged. That is one device over masked traffic, exactly the case the quality report is built to surface.
**Unique visitors** in the analytics dashboard counts Visitor IDs, and a Visitor ID is one device plus one cookie; its **Good bots** and **Bad bots** tiles separate search-engine crawlers from automated browsers. For cost per real visitor, count Device IDs, which hold through cleared cookies. The [identifiers reference](/features/identification) has the full mechanics.
## Where to go next
If you have not installed the snippet and a webhook yet, start with the [Quickstart](/quickstart). To understand the Risk Score and the named risk signals behind the split, read [Risk Score](/features/risk-scoring) and [Risk signals](/features/risk-signals); [Traffic Analytics](/features/traffic-analytics) covers channels, referrers and campaigns in depth. Per-source payout decisions build on this in [Affiliate Fraud](/use-case/affiliate-fraud), and the [Billing](/billing) page covers the included identifications on each plan.
This documentation is built and hosted on [Mintlify](https://mintlify.com), a developer documentation platform.