

September 2026
New analytics dashboard
The analytics dashboard has a new layout built around your users. A new Analytics dashboard section in these docs walks through each screen, with screenshots in the light and dark themes:- Overview: traffic quality, your users and their High-Risk Events, unique visitors with good and bad bots, risk signals, the riskiest identifications and your top traffic sources.
- Analytics: identifications, unique visitors, users, devices and public IPs, with Trusted, Suspicious and Dangerous filters, saved views and CSV export.
- User, device, visitor and IP cards: the band of each identity for the period, its High-Risk Events, its linked identities and the identifications behind them.
- Identification card: the Risk Score, each risk signal with its weight, and the risk of the user, device, visitor and IP behind one identification.
- AI Copilot: answers about your traffic from your own numbers, with evidence you can open.
- Integration: Install, Domains, API keys and Webhooks.
- Usage and plan: the identifications used this billing cycle, your plan and billing.
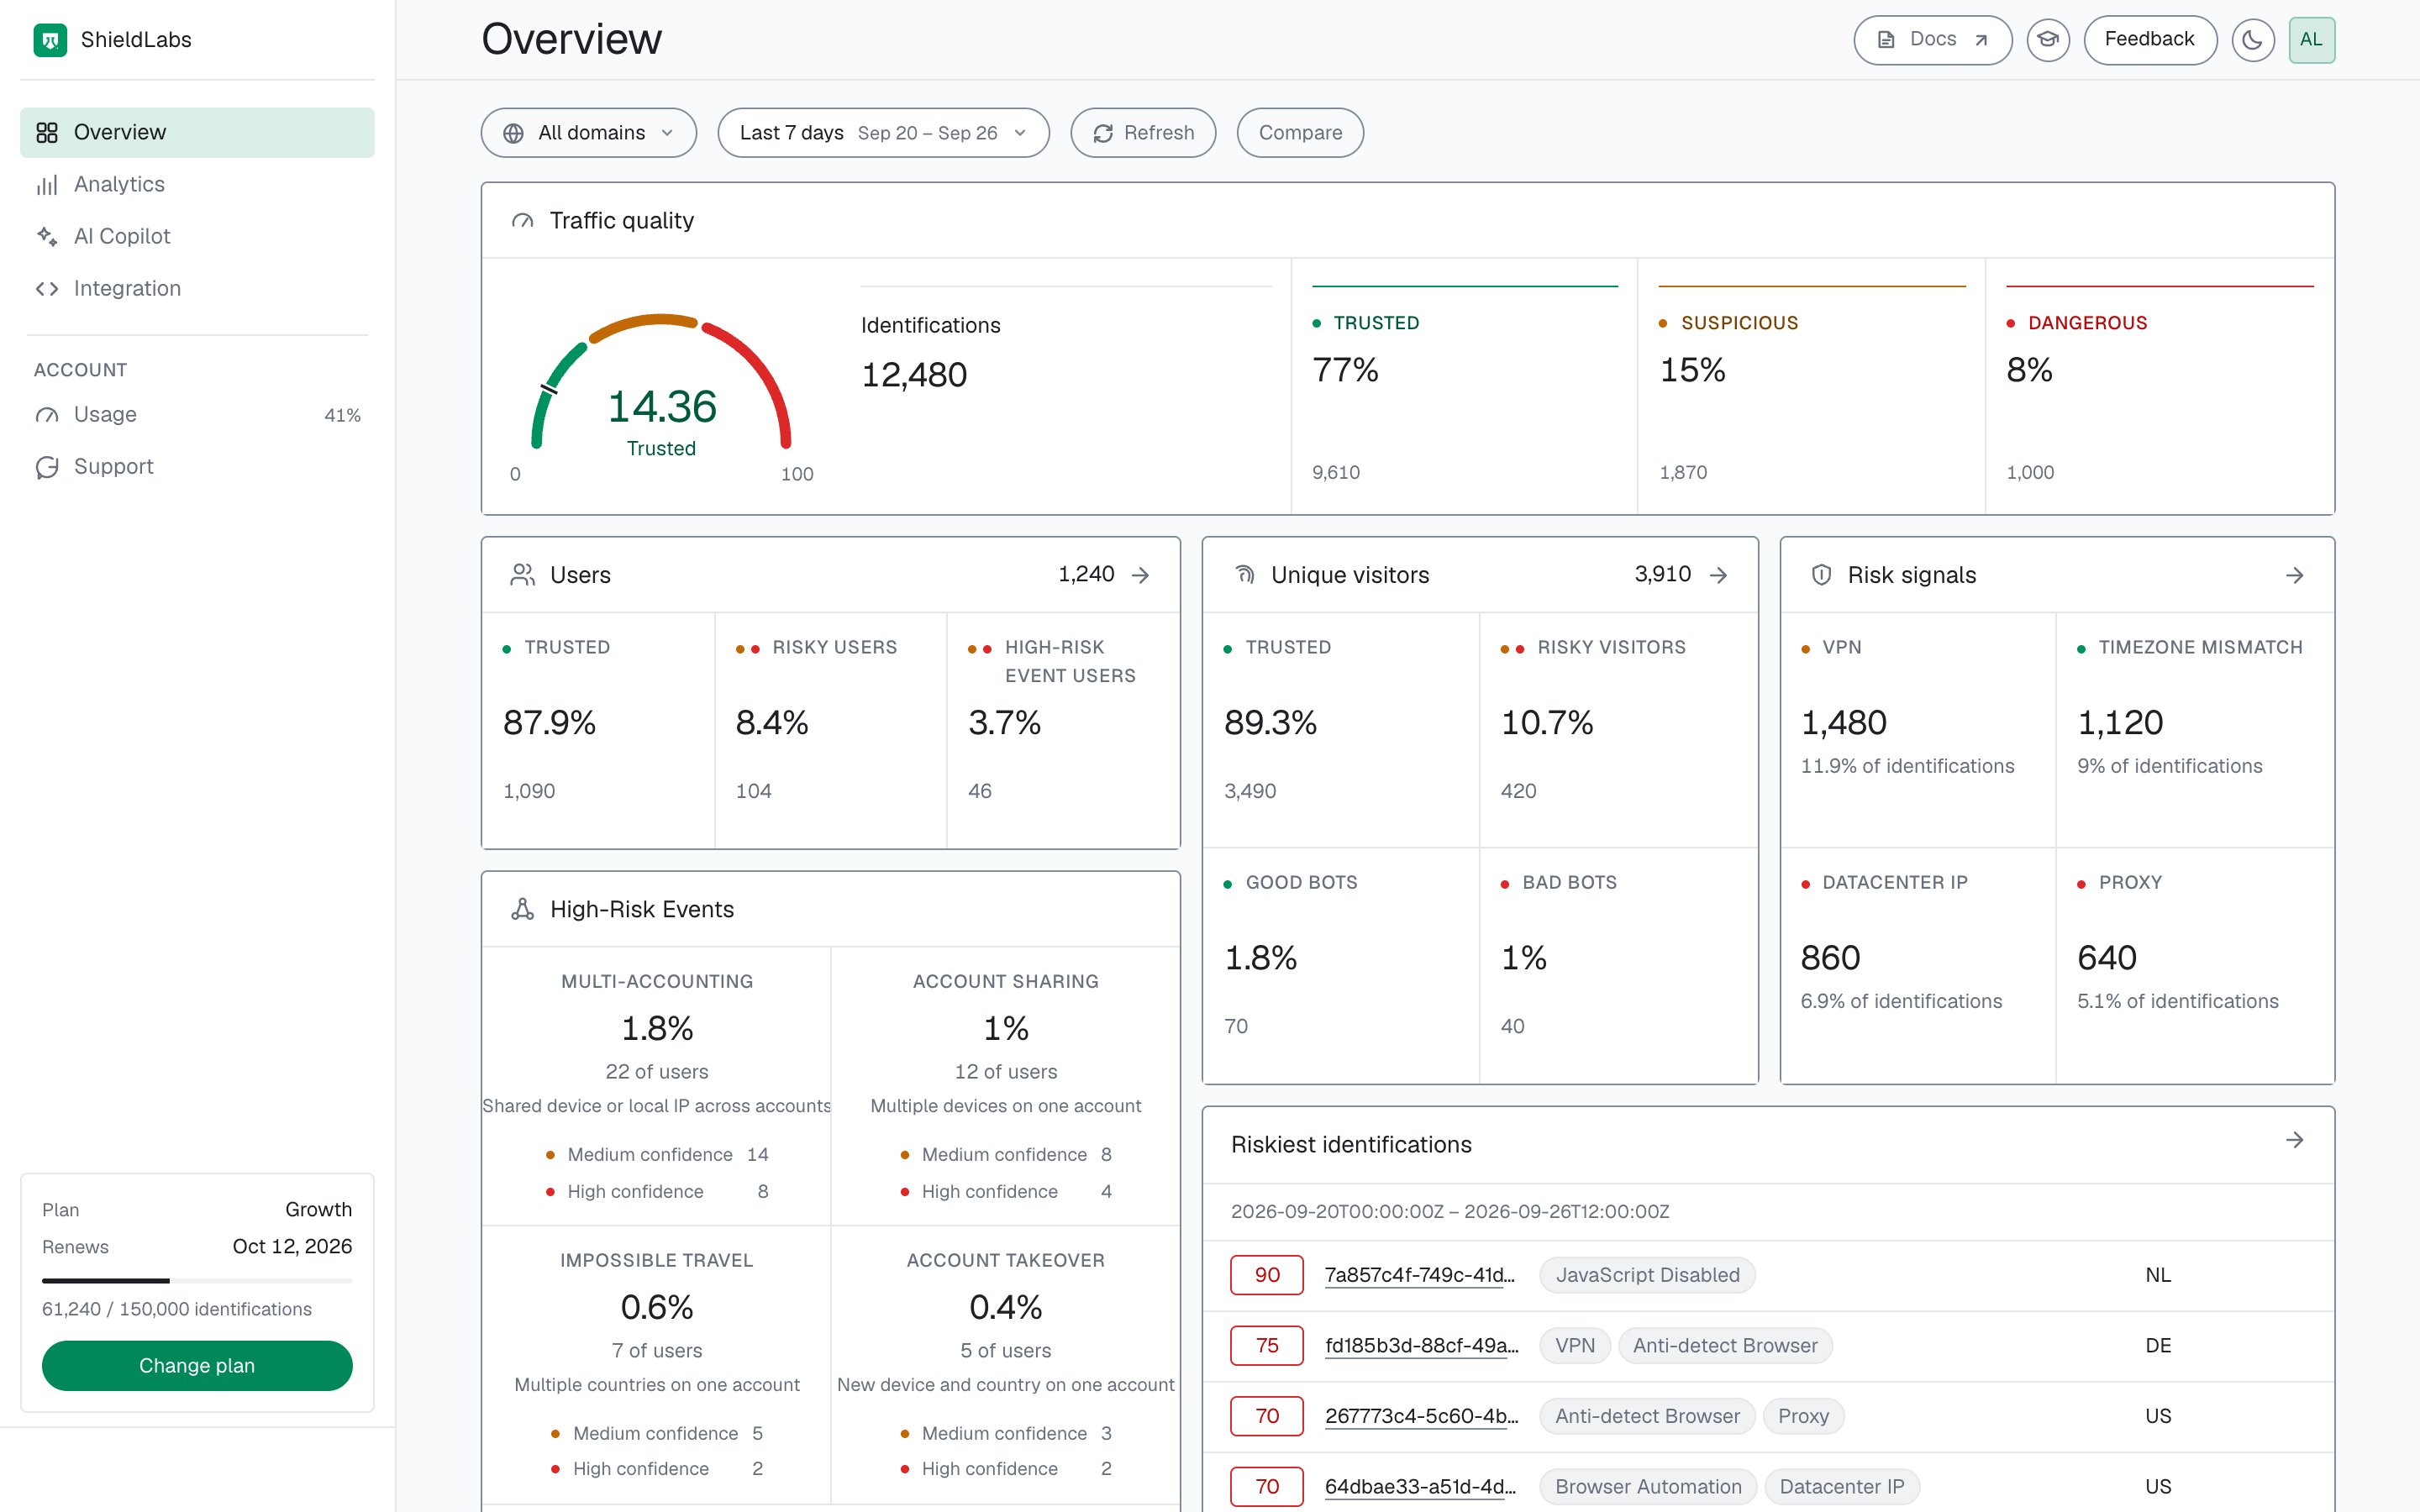
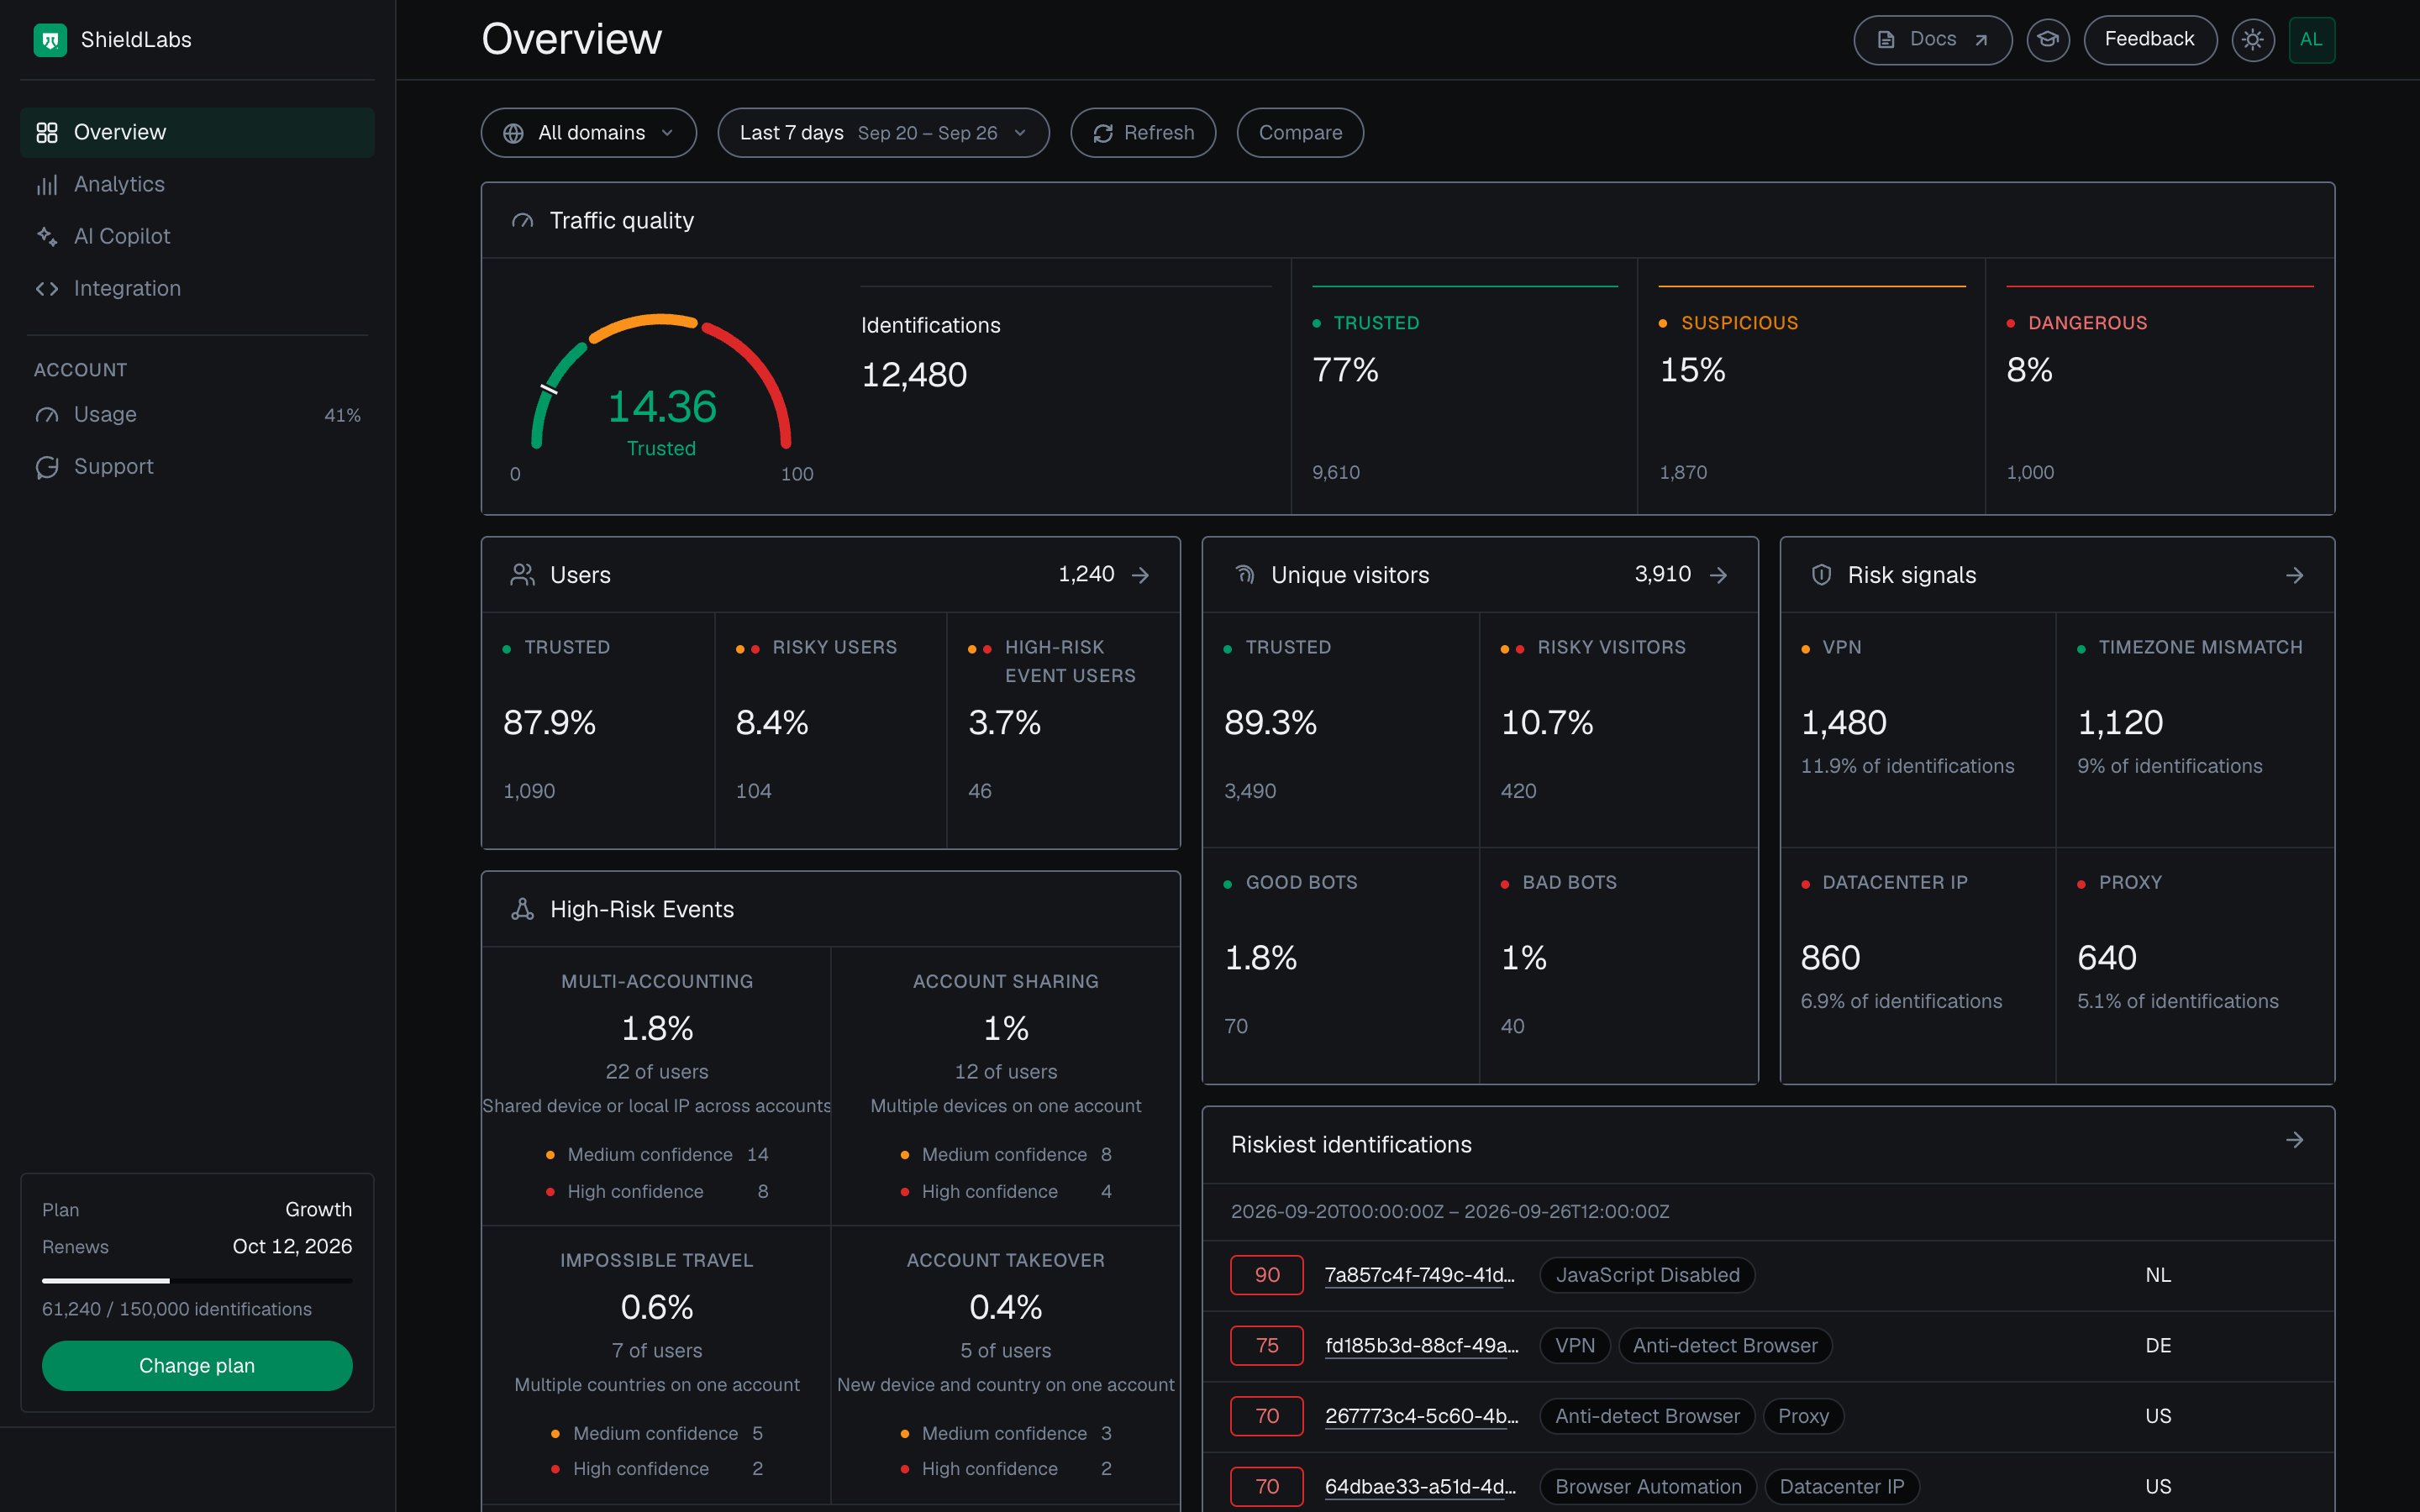
The Overview screen of the analytics dashboard: traffic quality, users, High-Risk Events and risk signals for the selected period.
Users, devices, visitors and IPs
The docs now describe ShieldLabs at the account level. ShieldLabs works with five identities, each with its own risk and its own links: users (keyed by the hashed User HID you pass withcheckAuthenticatedUser), devices, visitors, public IPs and local IPs. Every user, device, visitor and IP carries the worst band of its identifications, and the four High-Risk Events are detected on your users. Underneath, each identification keeps its own Risk Score and named risk signals, delivered by webhook and readable through the History API.
Two new pages explain the model: Users, devices, visitors and IPs and Accounts and identifications. The History API recipe Read every identification of one account reads one user’s identifications by user_hid. The sidebar has a new Core concepts group, and Features is now Detection.
High-Risk Events and Risk Signals pages moved
The High-Risk Events page moved to /features/high-risk-events and the risk signals page to /features/risk-signals. Old links redirect.Documentation corrections
- The scored webhook arrives about 300 ms after the check in the browser, or at most about 10 seconds after it when follow-up network checks run. Earlier pages gave a longer upper bound.
- History API paths: the host is
https://account.shieldlabs.aiand every path starts with/api/v1/, for example/api/v1/history/user_hid/{value}. If you copied a base URL ending in/api, drop the/apisuffix, or requests go to/api/api/v1/.... - The snippet page documents the five-minute window of
checkAnonymousandcheckAuthenticatedUser, and when to callforceCheckAnonymousorforceCheckAuthenticatedUserinstead. - Anonymous examples send
"user_hid": "anonymous", as the snippet does. - The Risk Score runs from 0 to 100; the one value above 100 is
999, the rate-limit marker. Treat any value above 100 as that marker. - Branch on the
signals[].nameslugs and ondetection_flags. The risk signals table on Risk Scoring addsproxy_routed_antidetect(weight 60) and thestun_late_correctioncorrection (weight -30). - The webhook field is
risk_score; the History API keepsscoreandscore_details. - The OpenAPI spec lists all 19
detection_flags, addingcheck_incomplete. - One included volume per account, shared by all its domains. At that volume the identification request returns HTTP
402until the billing cycle resets or you change plan; History API and profile reads never return402. See Billing. - Ingest limits are per visitor IP and per domain. The shared cap of 40 requests per second listed in August was removed.
- Errors lists status codes and error bodies per API, including
429on the History API and the Management API. - Chat and email support is available on every plan, including Free. See Support.
Risk bands and High-Risk Events
The docs now use three Risk Score bands, Trusted (0-29), Suspicious (30-59) and Dangerous (60-100), and describe Multi-accounting, Account sharing, Impossible travel and Account takeover as High-Risk Events, each with a Medium or High confidence level. Bot detection is covered in Bots and automation on the Risk Signals page. Accuracy is stated as 99.9% for identification and 99.9% for risk signal detection. See Risk Scoring. High-Risk Events are available in the analytics dashboard, the API and webhooks. By default, Multi-accounting fires from 3 accounts on one visitor (one device plus one cookie) and Account sharing from 4 devices on one account; both thresholds are configurable. Multi-accounting is detected even after cookies are cleared, since the shared devices and network keep the accounts linked.Minor improvements and bug fixes
Maintenance updates to the OpenAPI spec and examples.August 2026
Domain freeze after 10s at plan RPS
If a domain stays at its plan ingest cap (5 / 5 / 10 / 15 RPS) for 10 seconds in a row, ShieldLabs pauses processing for that domain: the same HTTP429 as other rate limits, and the domain is not Paused. The analytics dashboard shows the domain as Frozen until it resumes on its own. See Rate limits.
History API soft rate limit
The account History API onaccount.shieldlabs.ai now allows 15 requests per second per domain. A 429 is soft (no ban). This is independent of ingest per-IP / per-domain limits. See Rate limits.
Ingest limits and plan quotas documented
The Billing and Rate limits pages now match production:- Active domains per plan: Free 1, Starter 1, Growth 3, Scale 5. Existing domains over the cap keep running; only new creates are refused.
- Per-domain REST ingest: 5 / 5 / 10 / 15 requests per second (soft
429, no domain ban). - Per-IP REST ingest: 15 requests per minute, then a 10-minute ban (not 20/minute and not a 1-hour ban).